

Software and app
The BYB Telemetry suspension analysis software and app
It turns a thousand readings a second into one clear next move.
- Platforms
- 4
- Data it reads
- 1000 Hz
See the rangeWhat the hardware records
BYB Telemetry provides a desktop application for Mac and Windows, and a smartphone app for iOS and Android — both free with every kit. Run advanced analysis or download and review a run directly at the track. Plus, the auto tuning can help in proposing the next change.
Two products, one system
A desktop application developed for deep analysis. A phone app to review runs at the track. Both talk seamlessly to the same acquisition unit, and neither replaces the other.
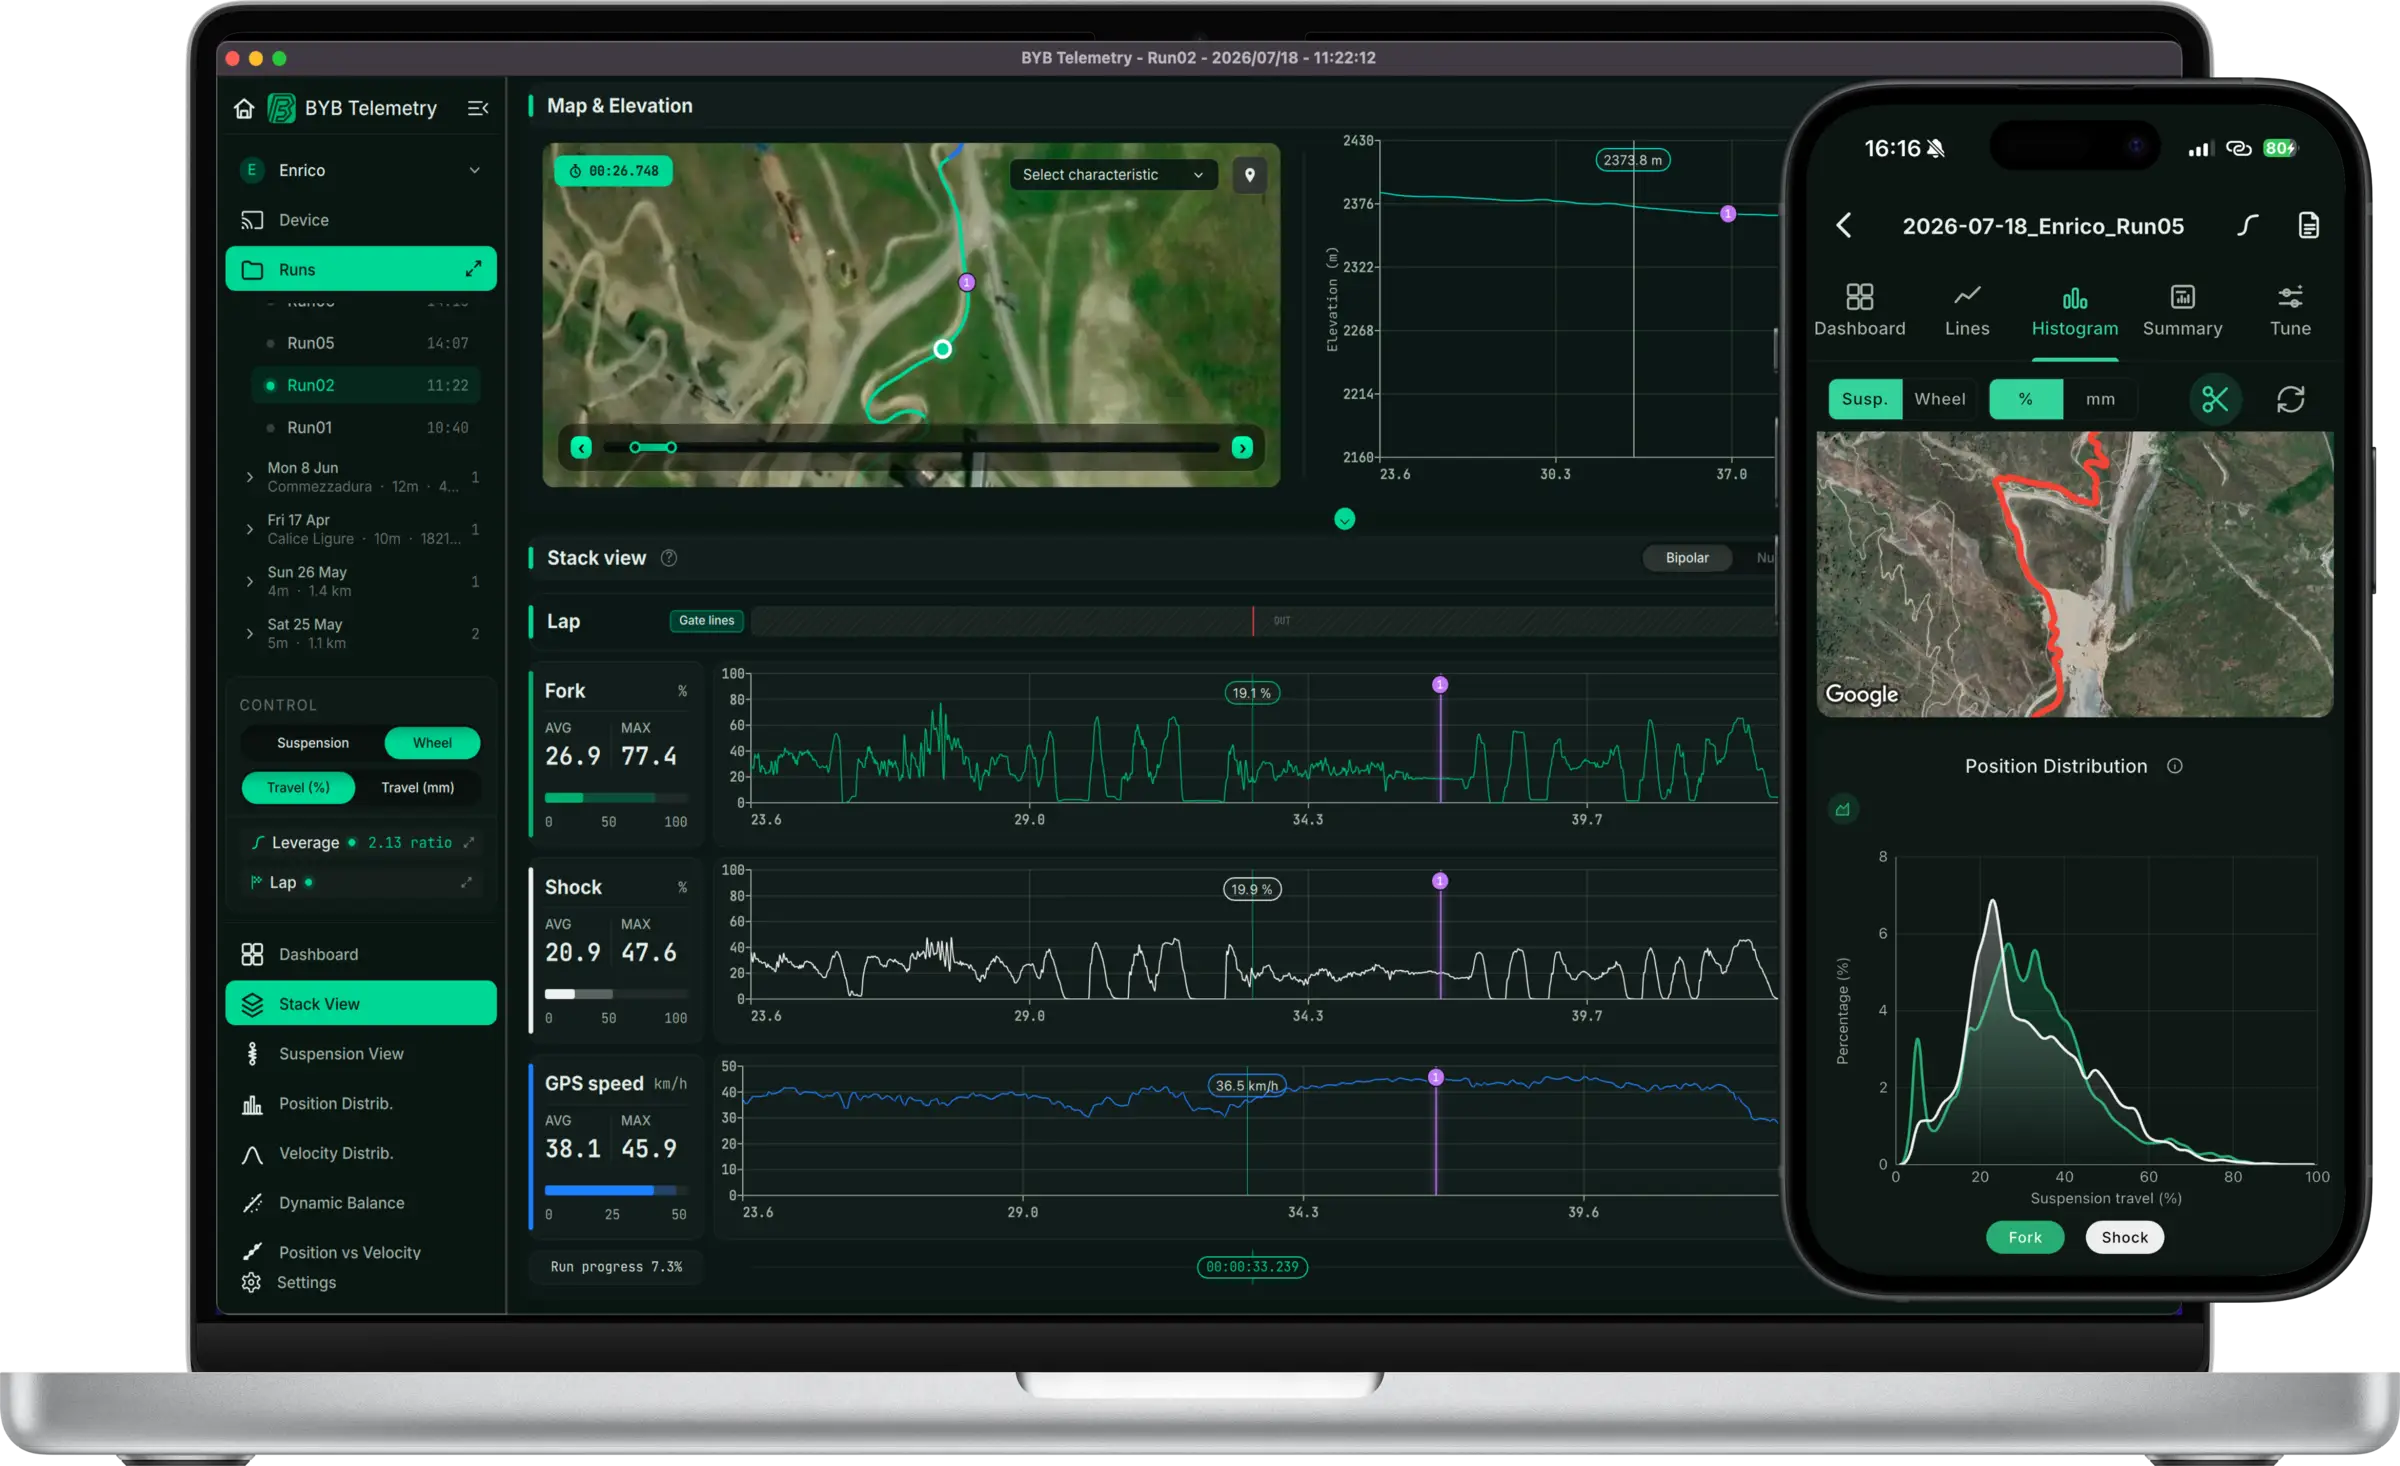
Two products, reading the same acquisition unit — the desktop software and the mobile app, side by side.
macOS · Windows
The desktop software
- Advanced analysis, from dashboard to auto tuning.
- All the charts are readable and easy to interpret, letting you spend either 5 minutes on a run or hours.
iOS · Android
The mobile app
- Trackside analysis, from instant summaries to auto tuning.
- Every screen is built for speed, letting you check a run in seconds or read the full session before you leave the track.
The desktop software
What's included
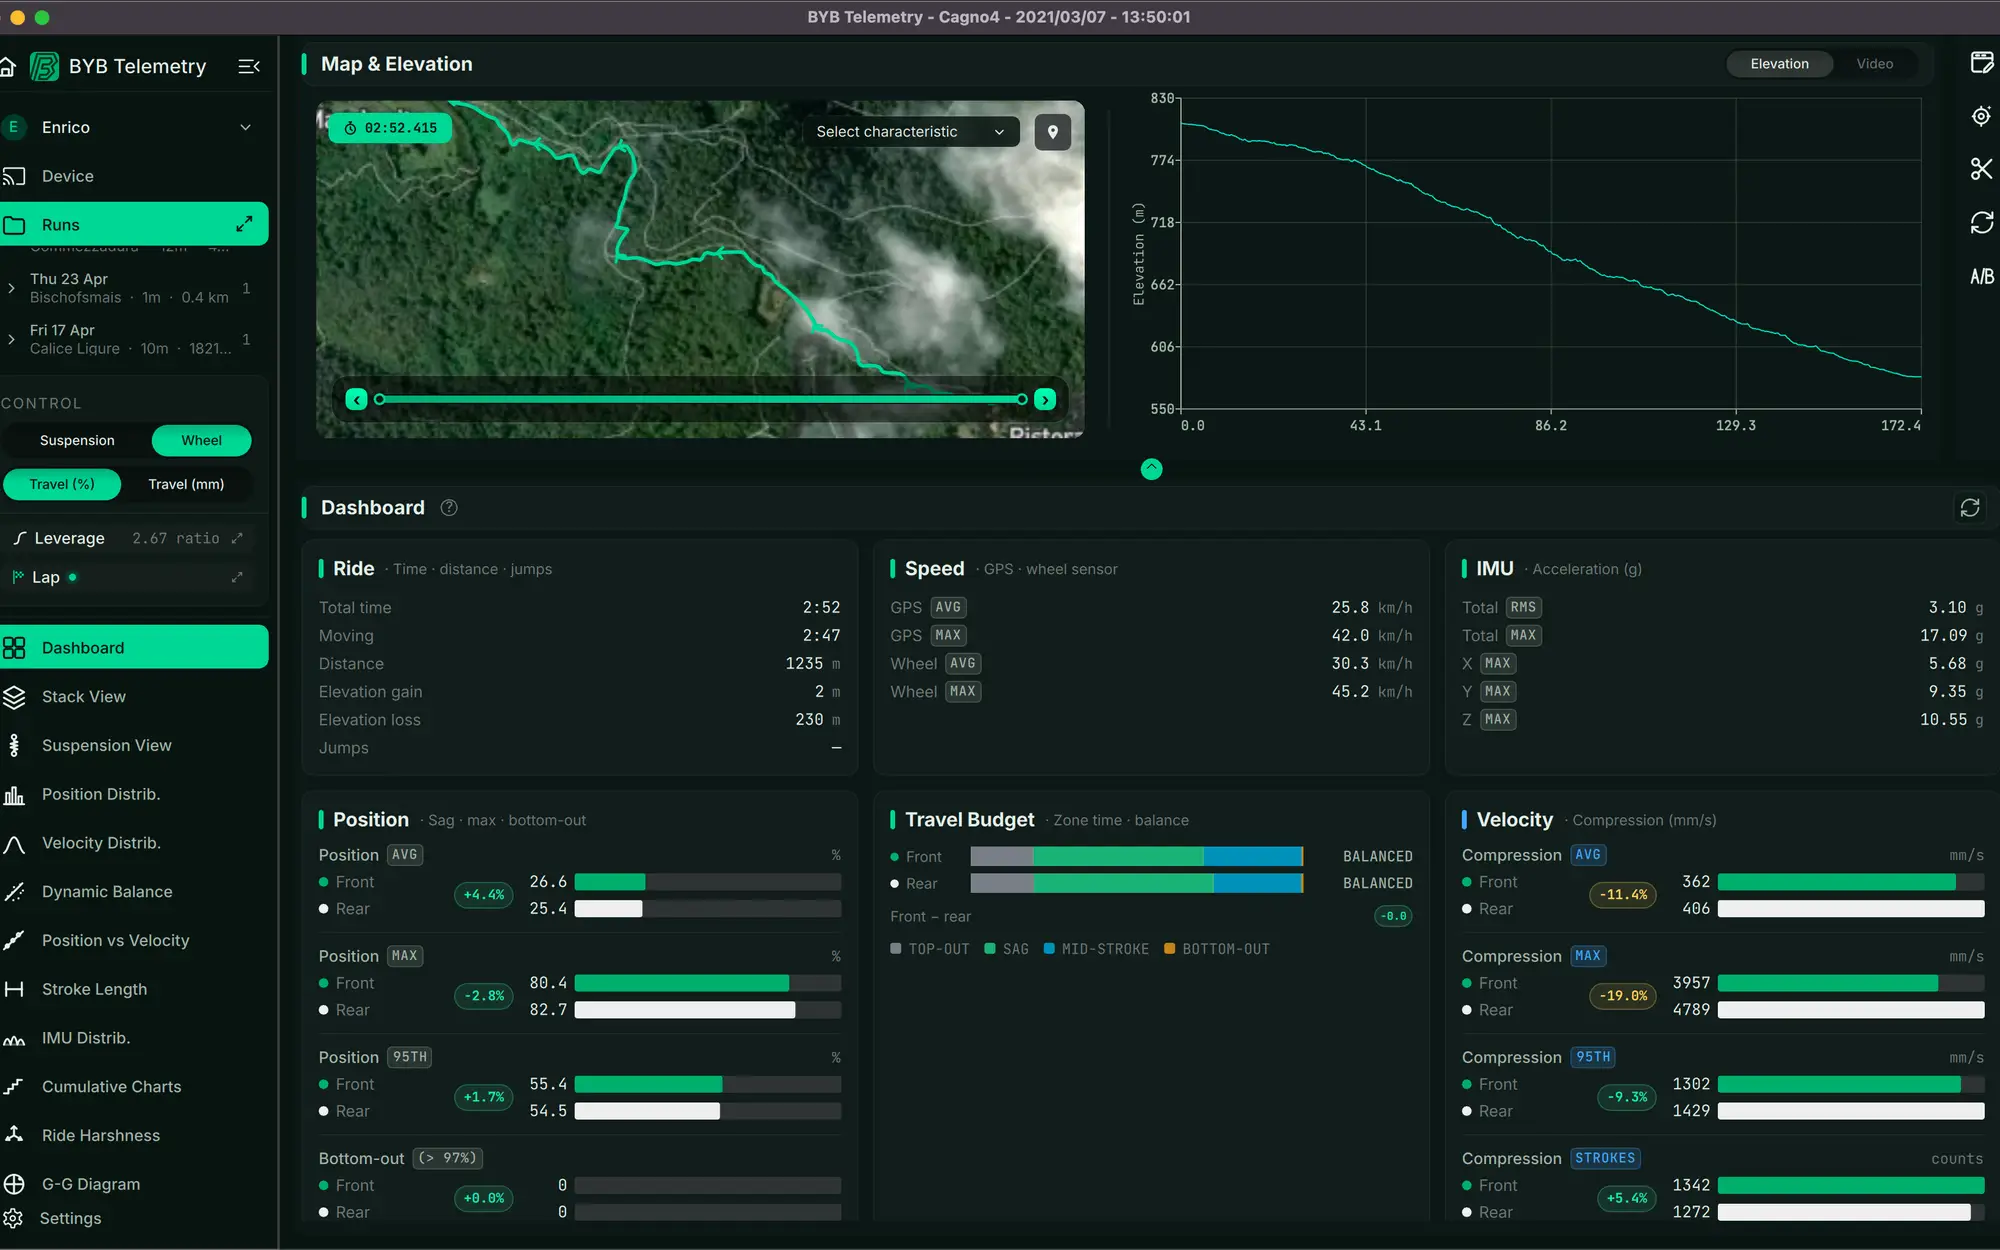
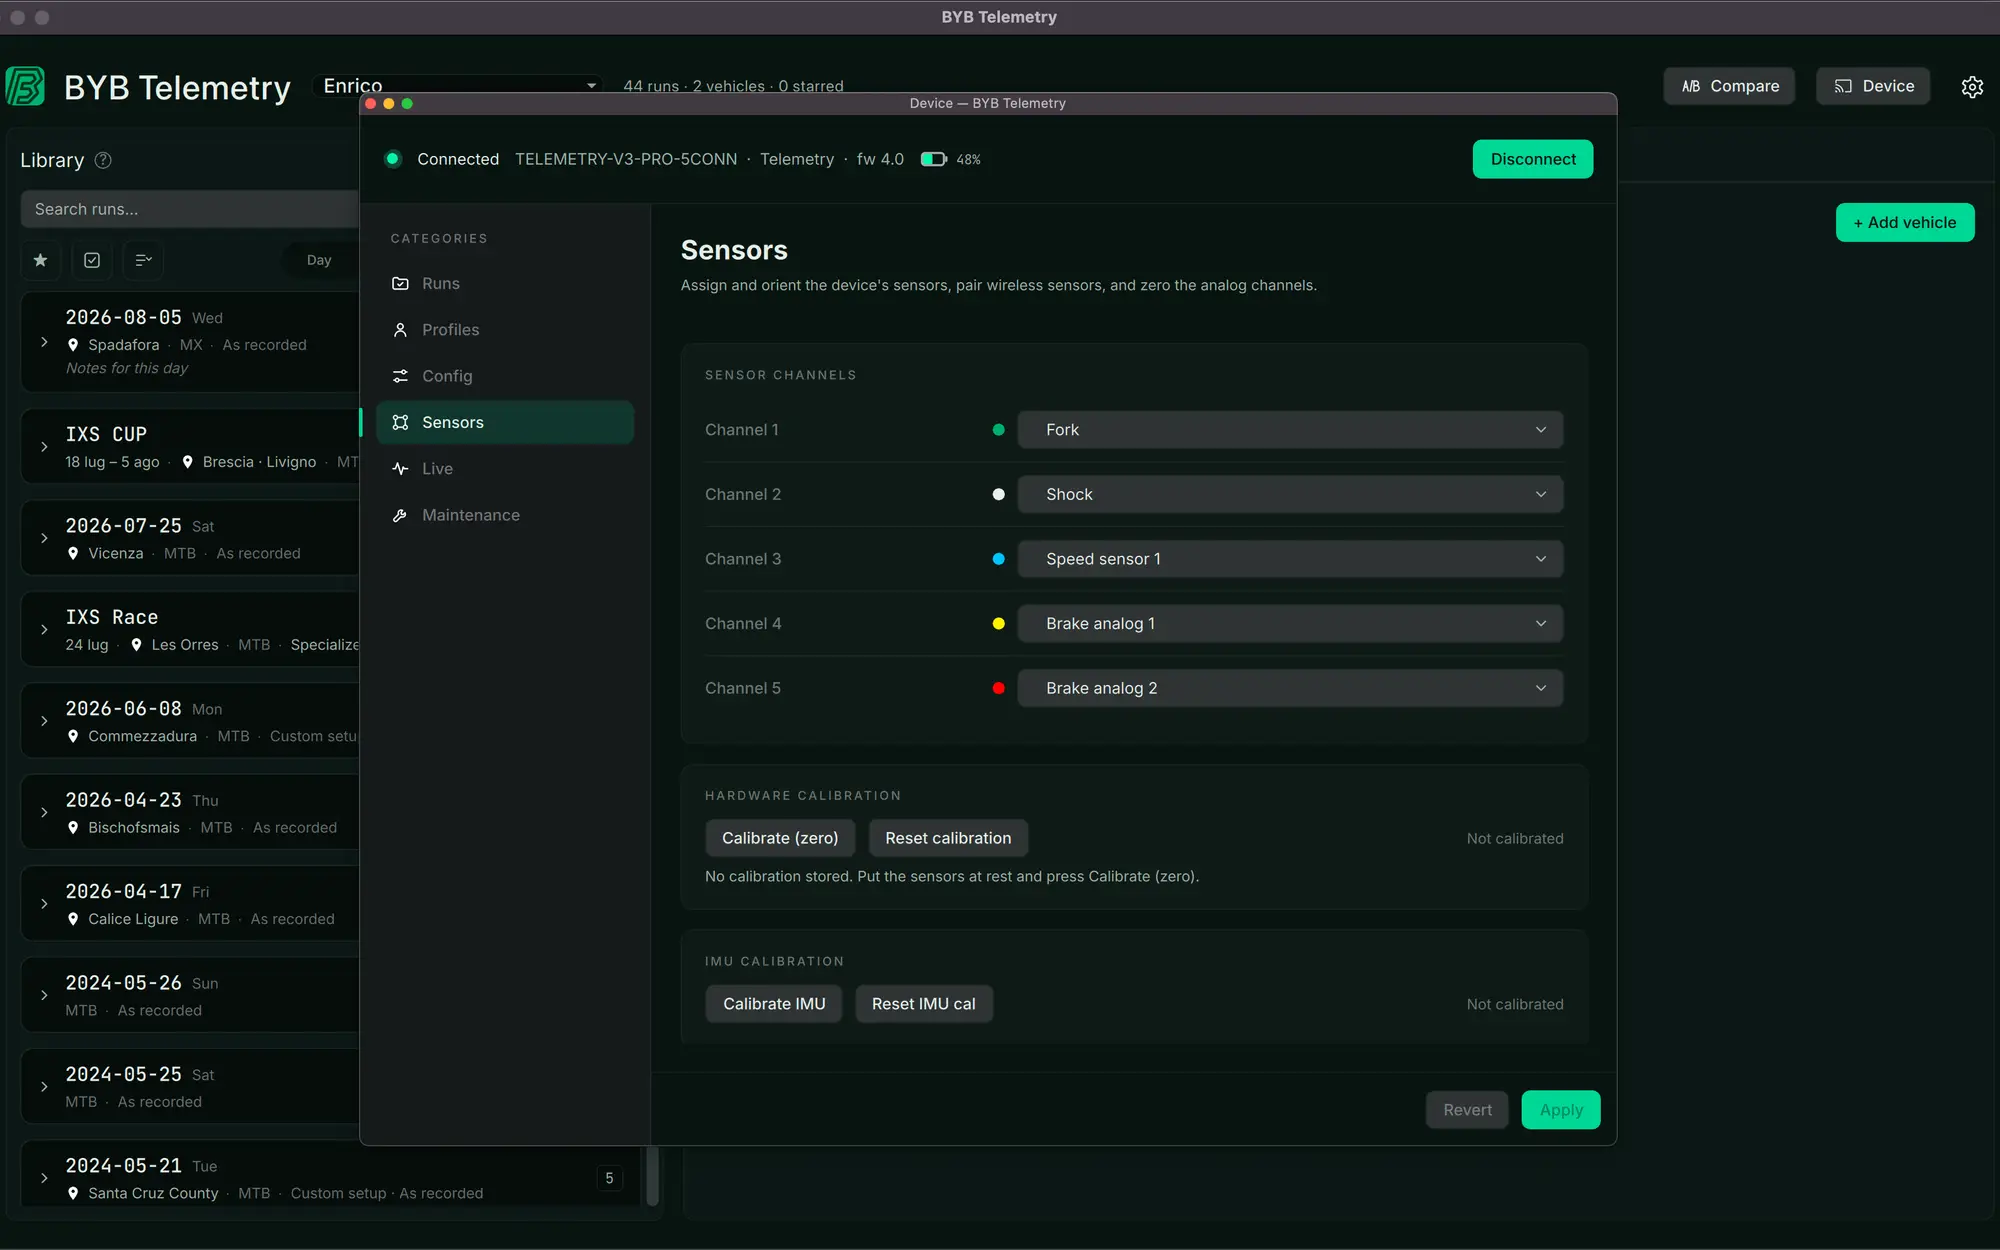
One desktop application for Mac and Windows, with everything a suspension setup needs — connectivity, analysis, timing and tuning. The views below are a selection, not the whole of it.
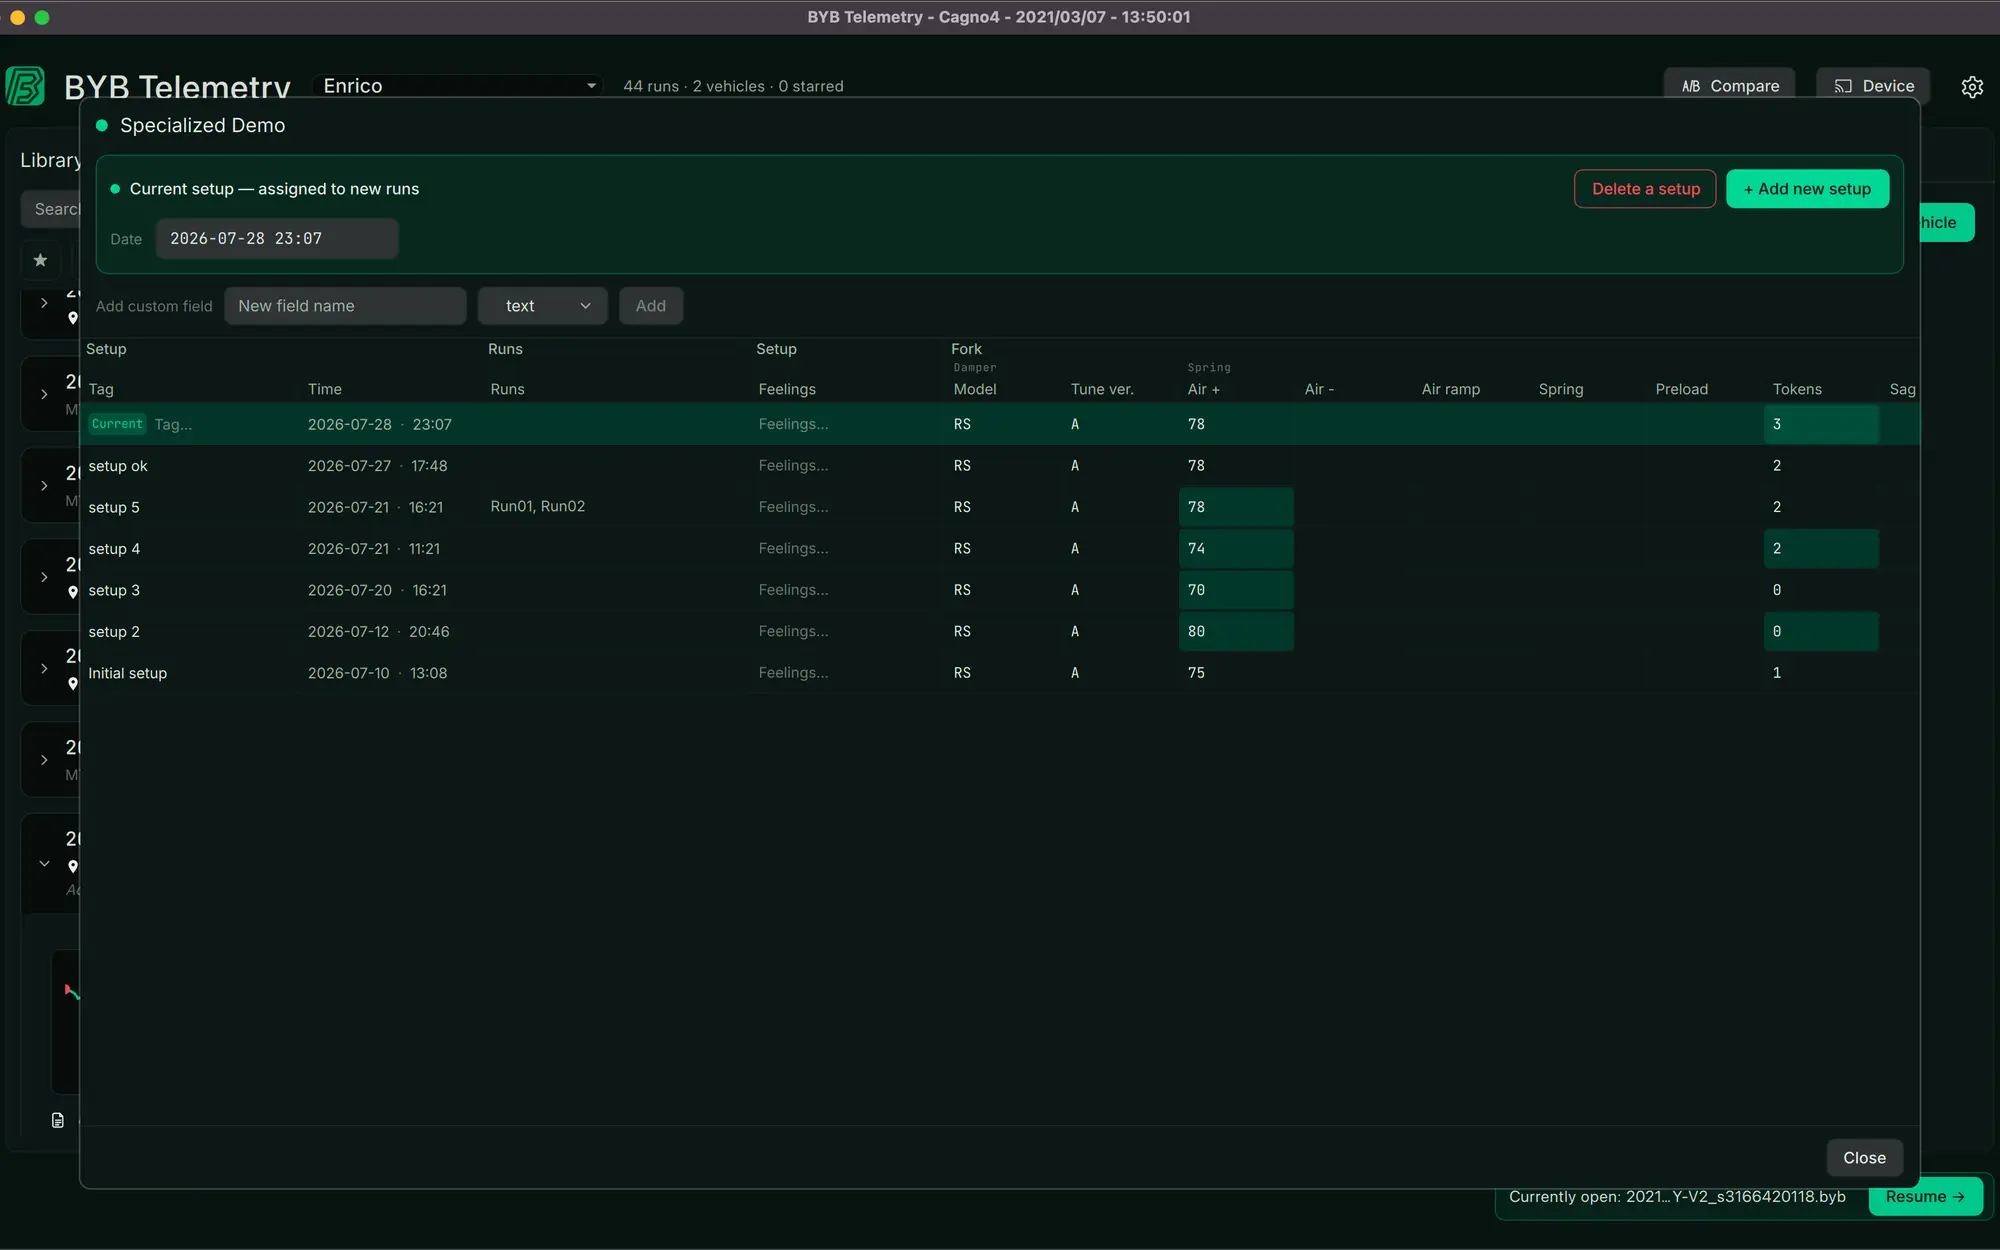
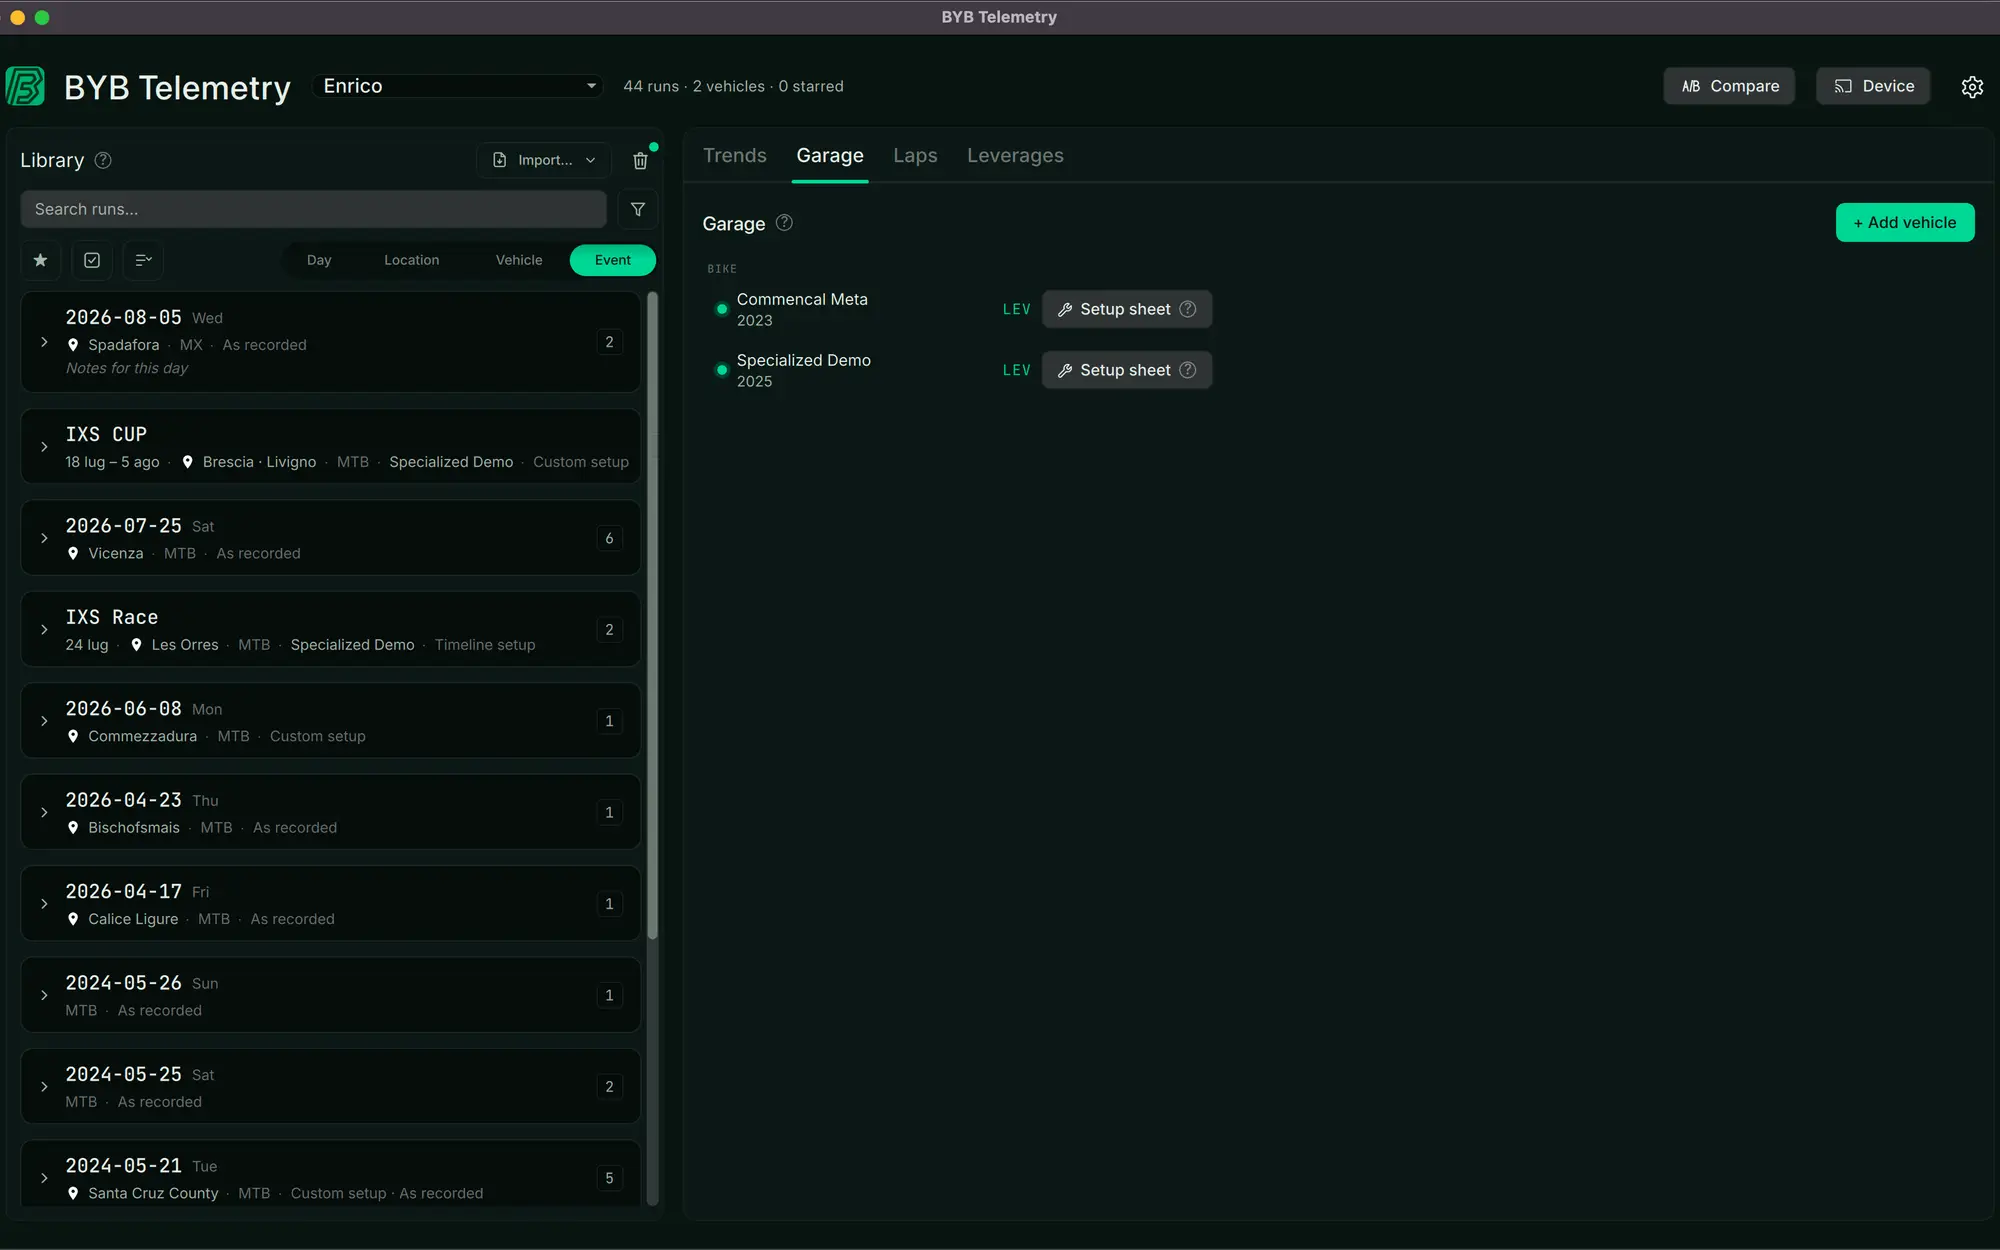
What the software does, in six jobs
The analysis views, grouped by what you are trying to find out. Read top to bottom, they are a session from start to finish.
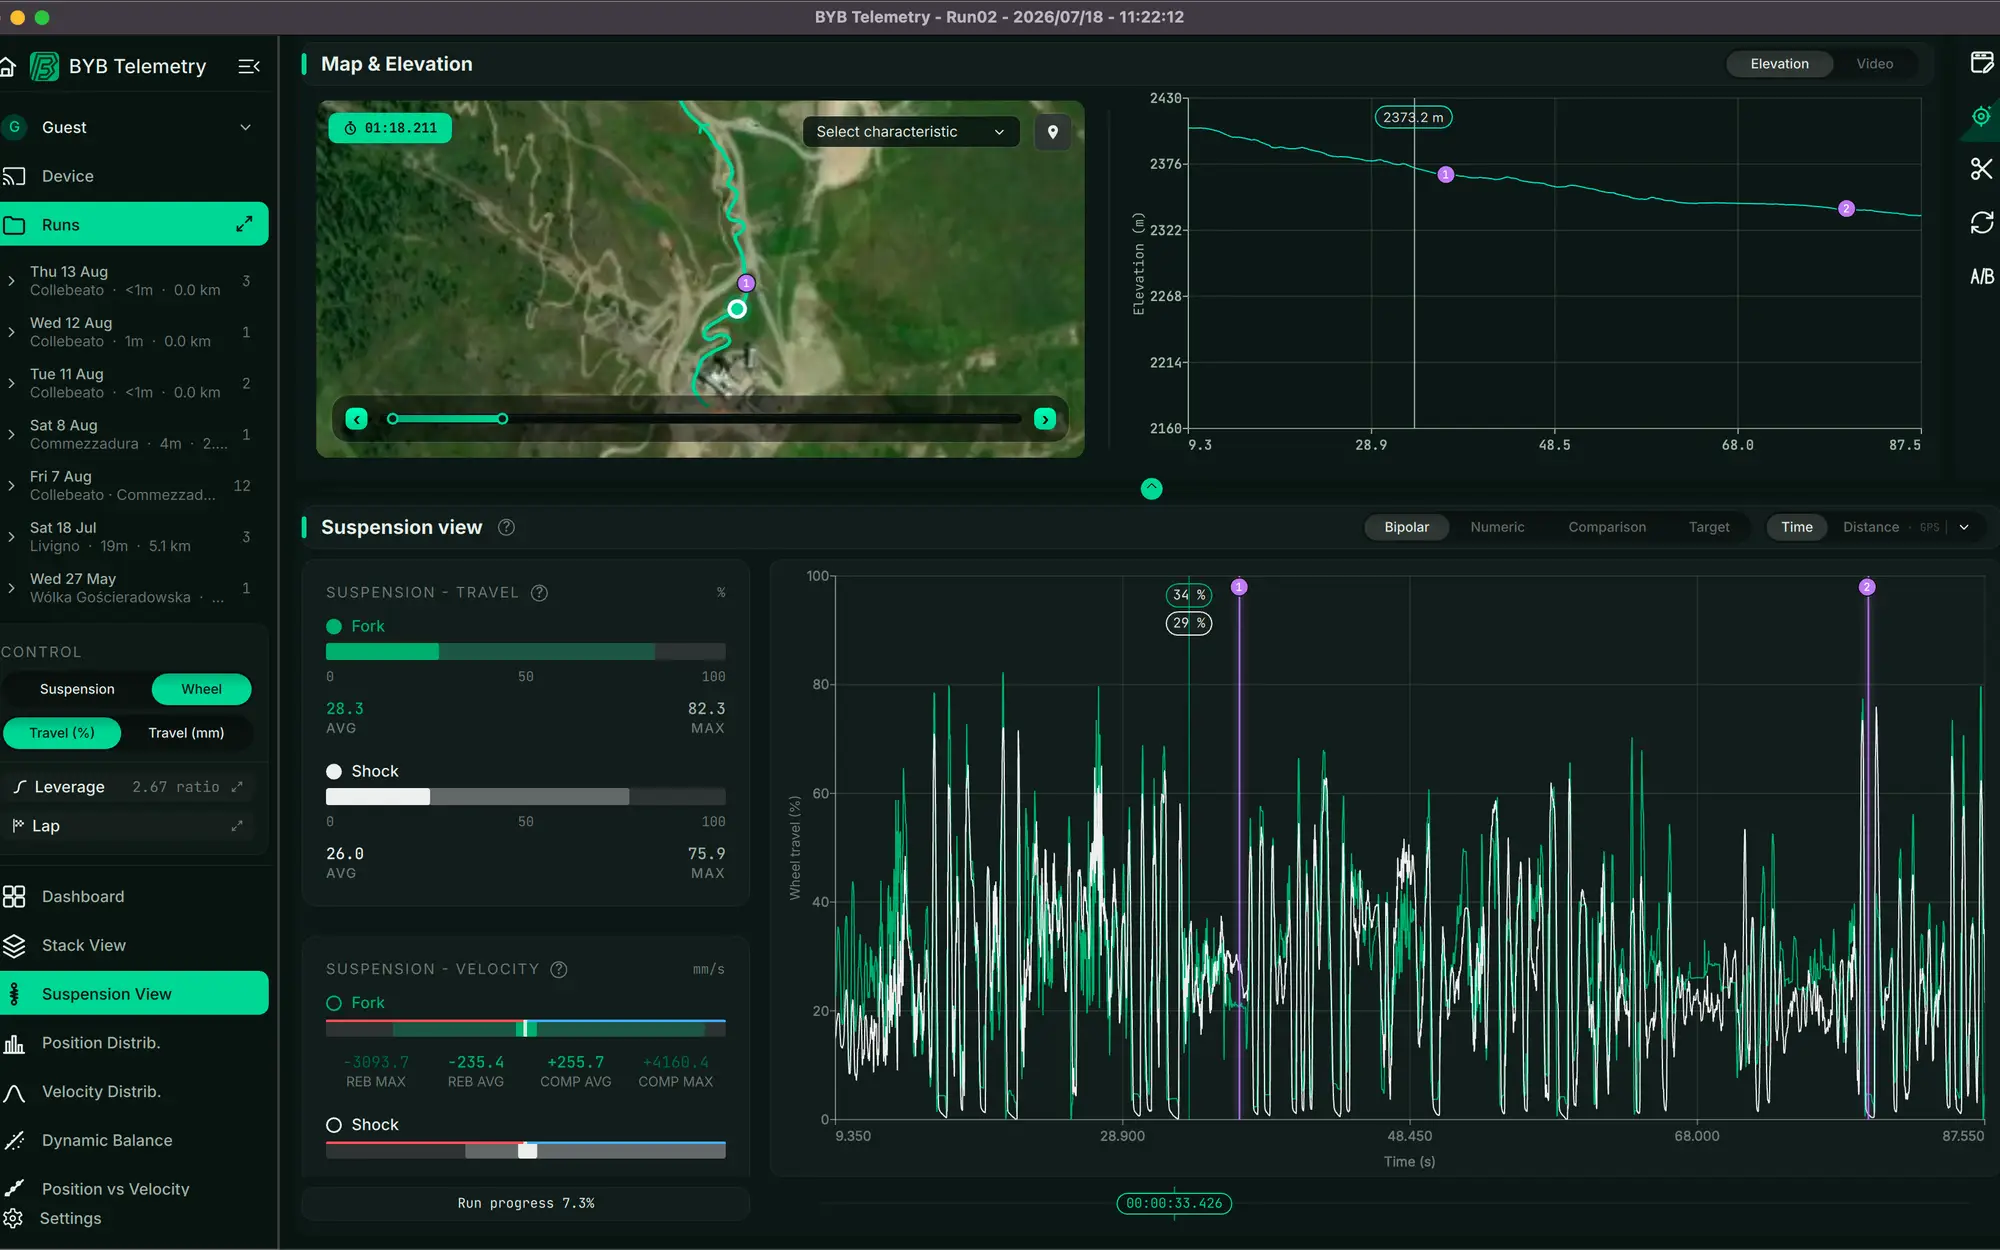
See the run
8.2 seconds of a recorded run, 1000 samples a second. The fork peaks at 78% of its travel and the shock at 72%; the flat stretches at zero are the wheels off the ground. Find the pattern
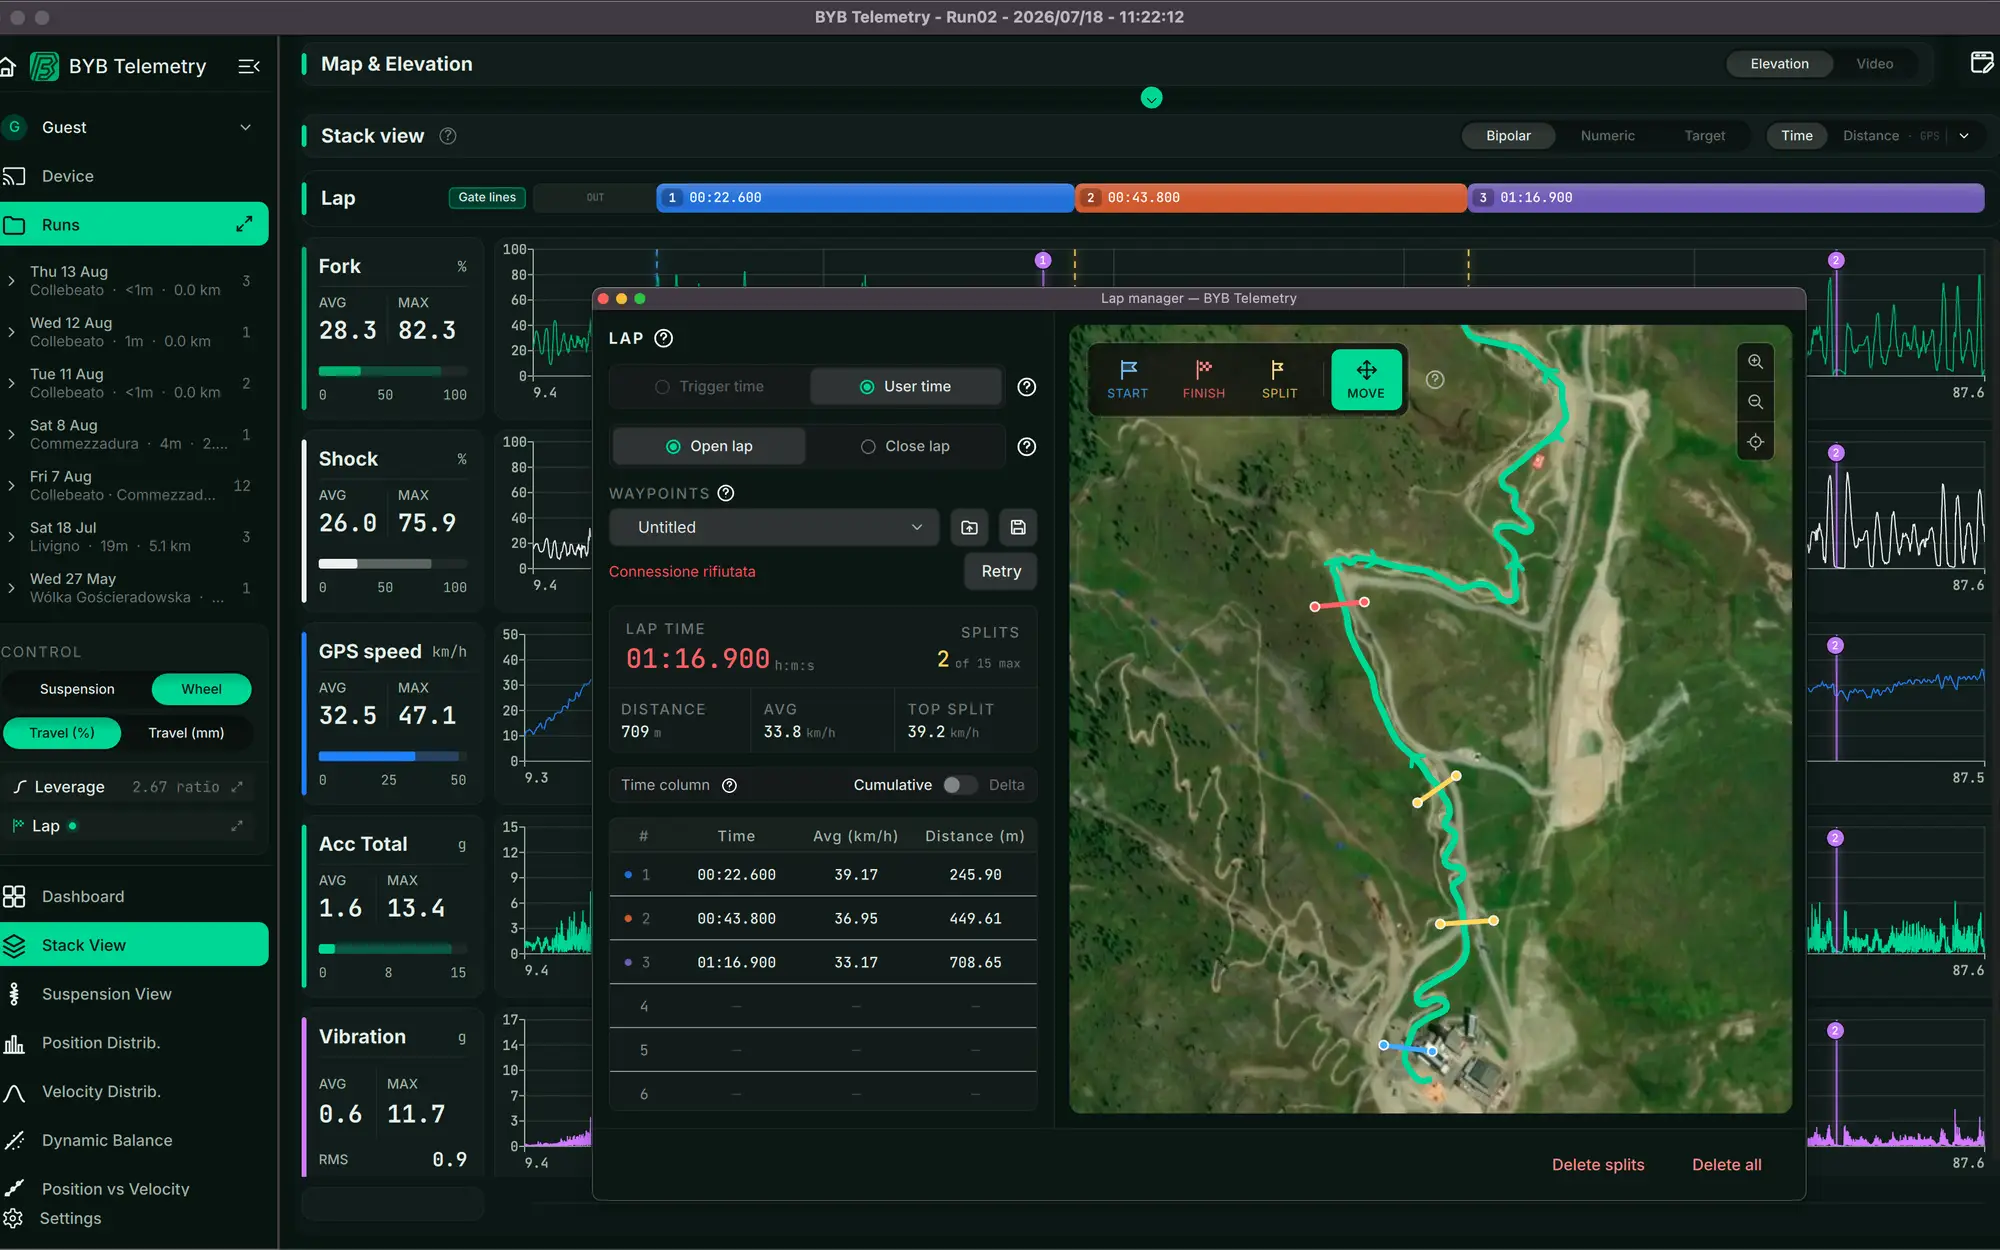
One recorded lap at Livigno, drawn from the run's own GPS: 743 m in 01:13.839 through 4 gates. Point at any gate for its time. The quickest section is into gate 2 at 40.0 km/h, the slowest into gate 4 at 33.0 km/h — where a run is won or lost. - AfterBefore
- Fork
- Shock
Compare
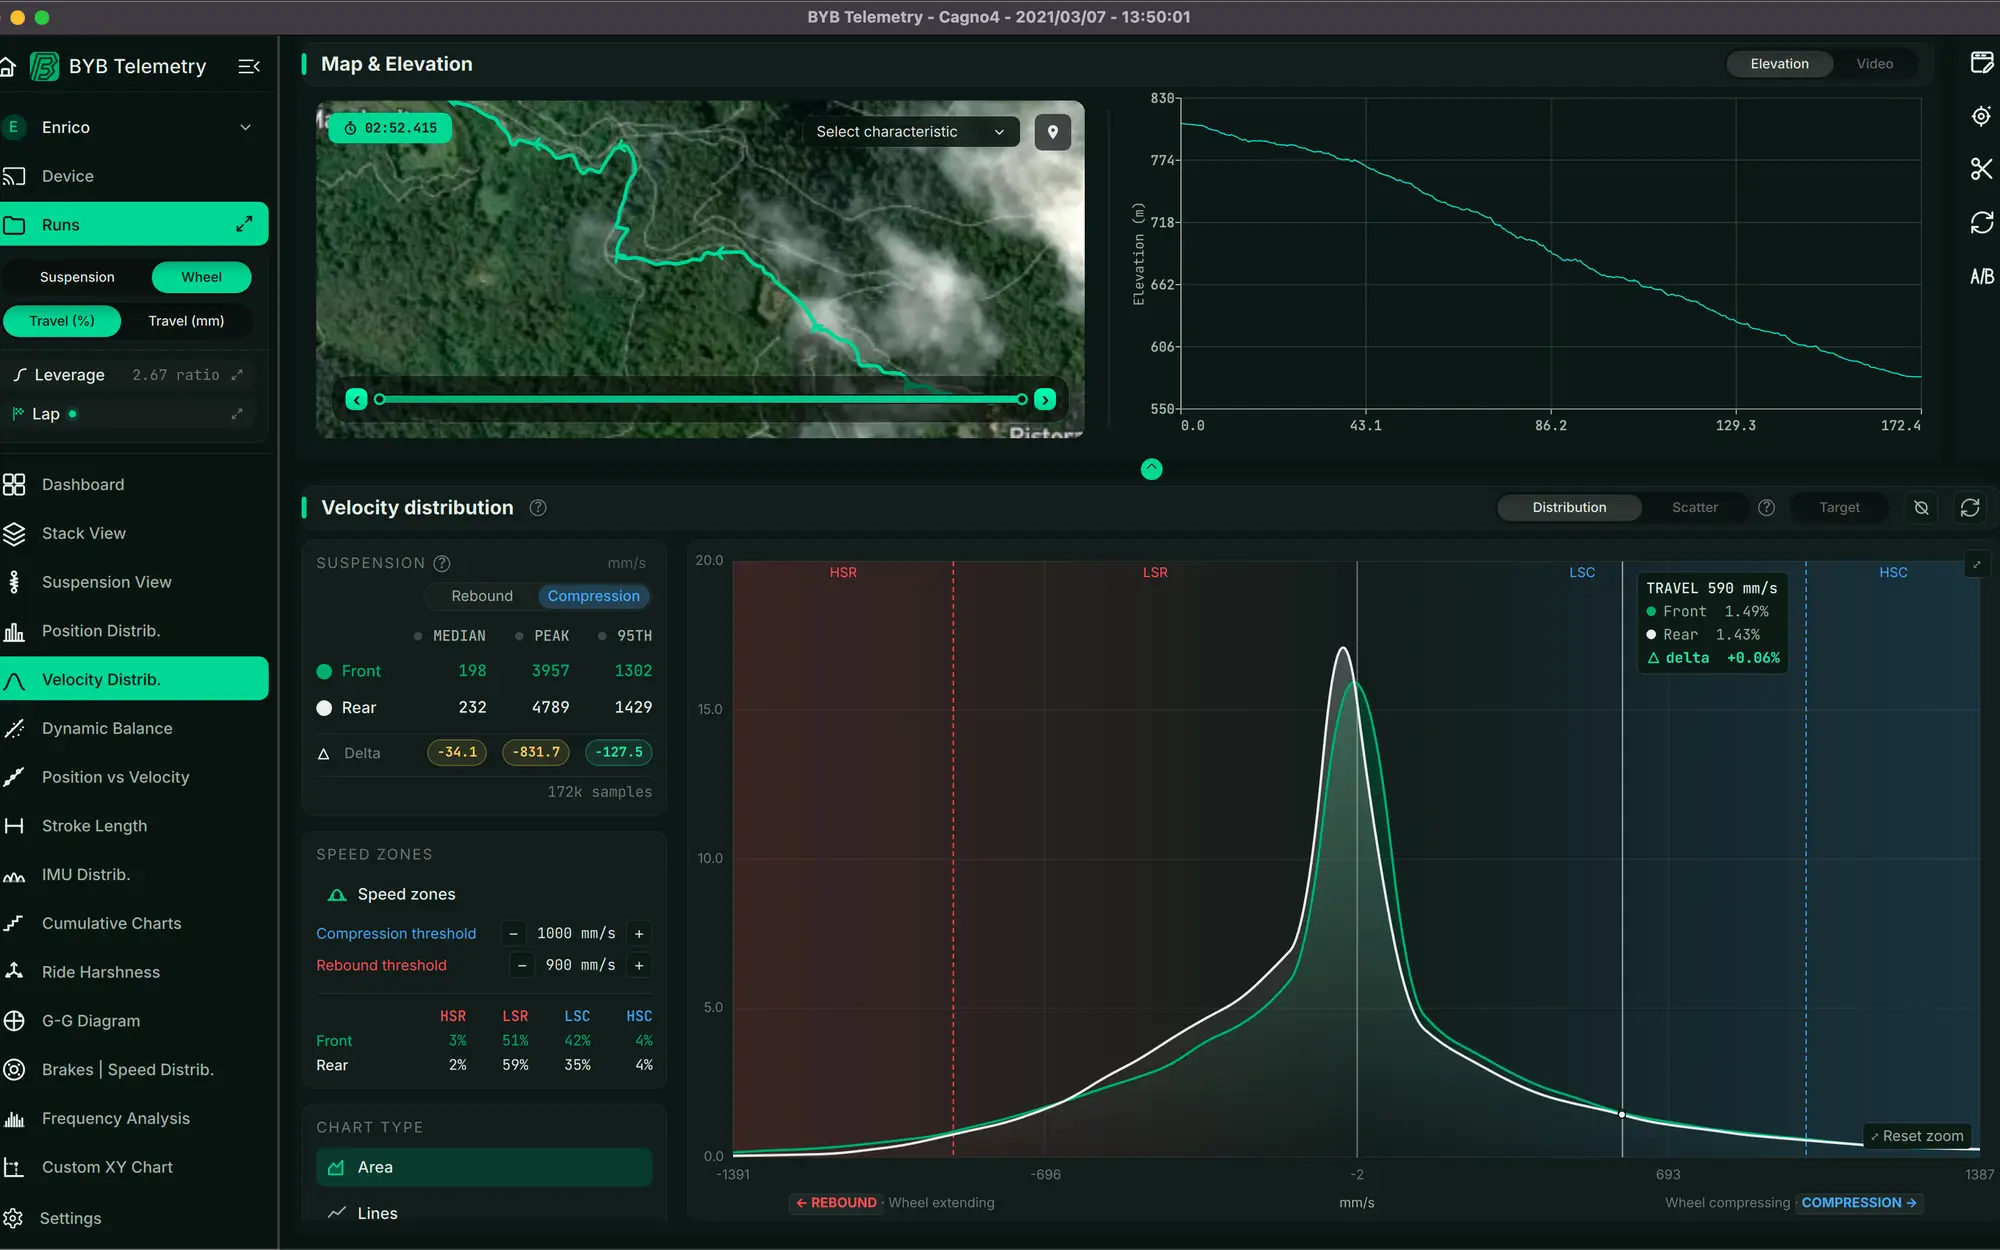
Where the suspension spent its time, either side of one clicker. Drag the divider: the rear moves from a narrow band low in its travel to the middle of it, and the front stops taking the peaks the rear was not. A density chart of fork and shock travel across two runs of the same trail, wiped between the run before a setup change and the run after it.
Model the bike
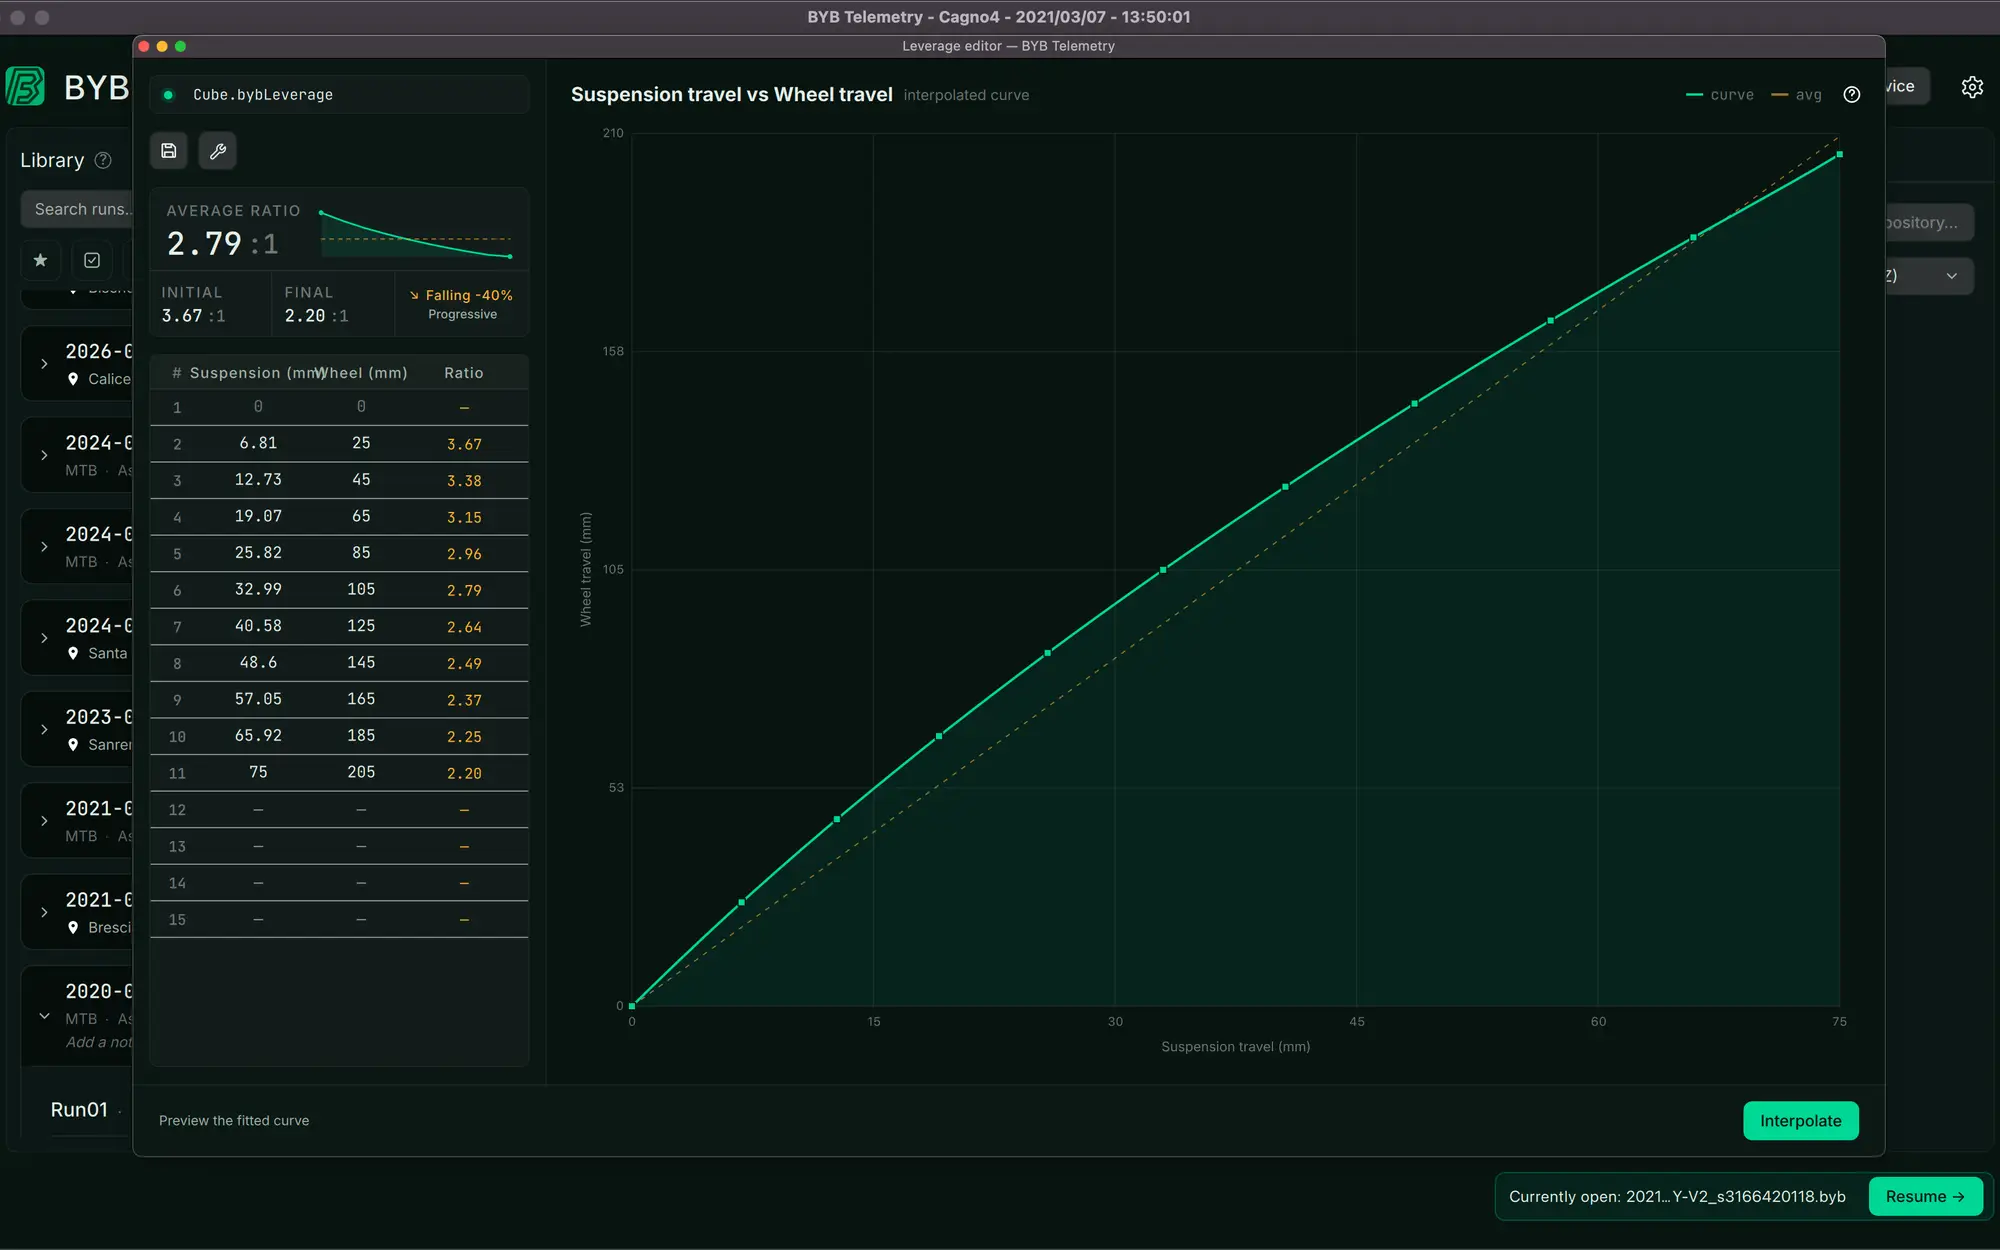
Eleven measured points from one bike's linkage. The ratio falls from 3.67:1 off the top of the stroke to 2.20:1 at bottom-out — a 40% drop, which is what progressive means: the further it goes, the firmer it gets. Step along the curve to read each point. Go deeper
The same run against frequency instead of time. Position peaks at 1.6 Hz on the fork and 0.6 Hz on the shock — the bike moving on its springs — while acceleration piles up near 23 Hz, which is the trail surface rather than the rider. Prove it
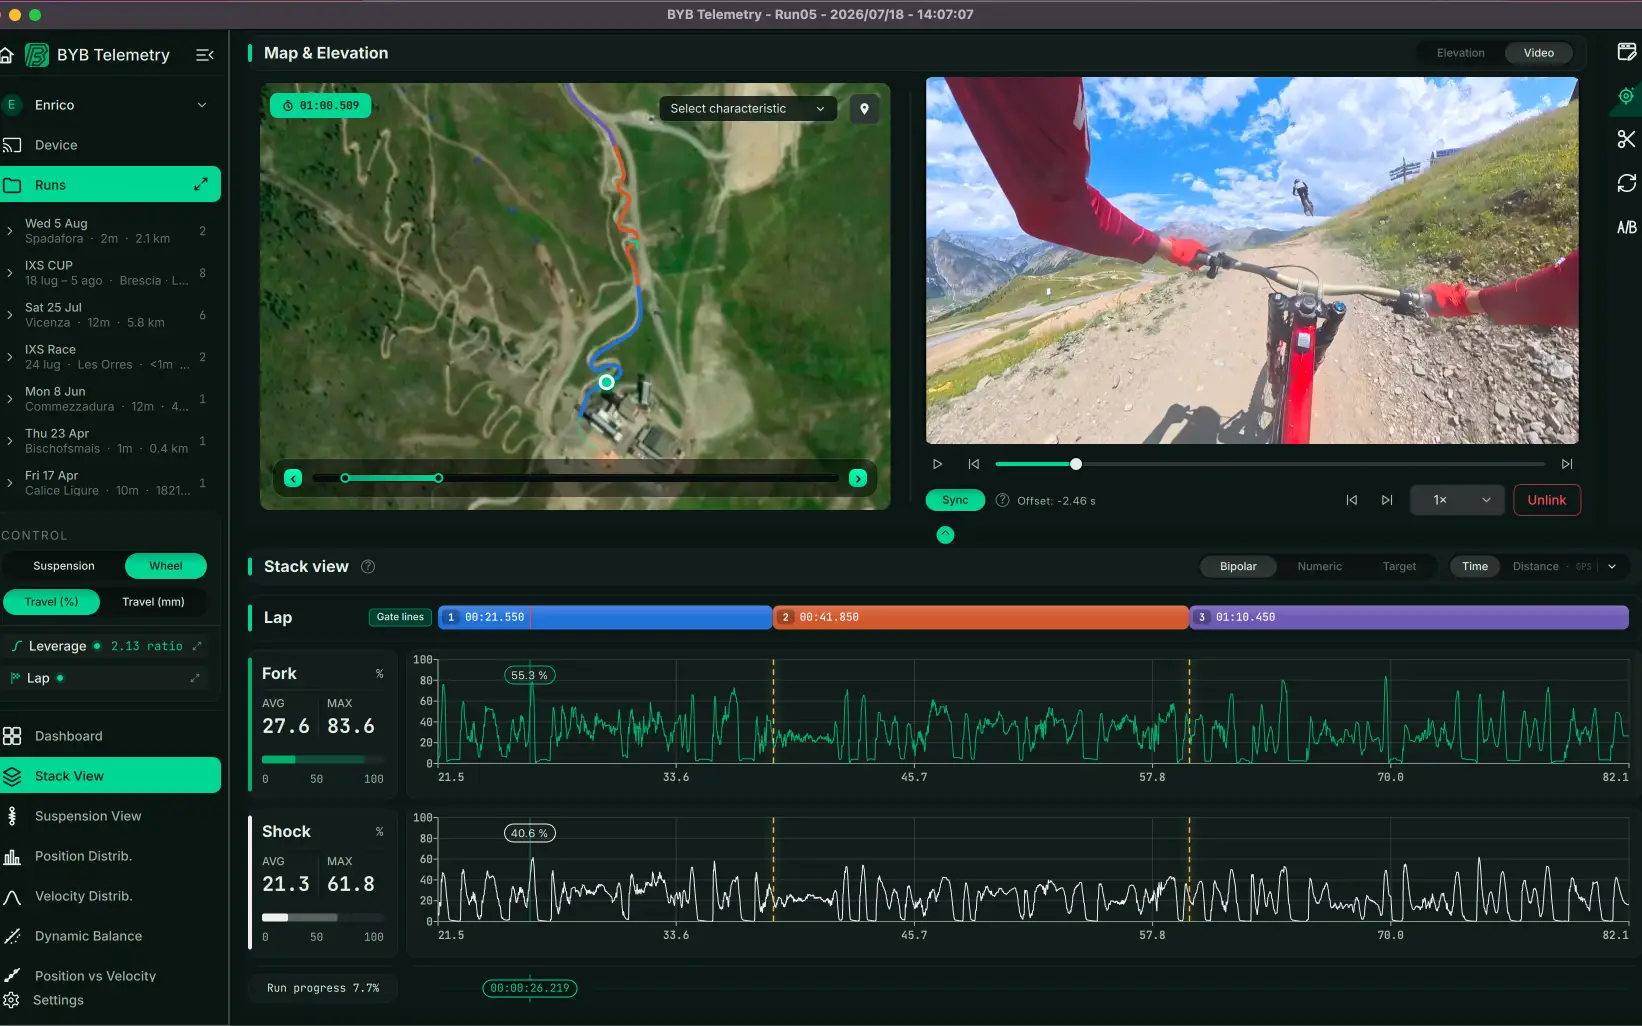
The run and the footage on one cursor. Scrub the trace and the video follows, so a spike in the fork and the rock that caused it arrive in the same frame — which is what turns a figure a rider does not trust into something they watched happen.
Auto tuning
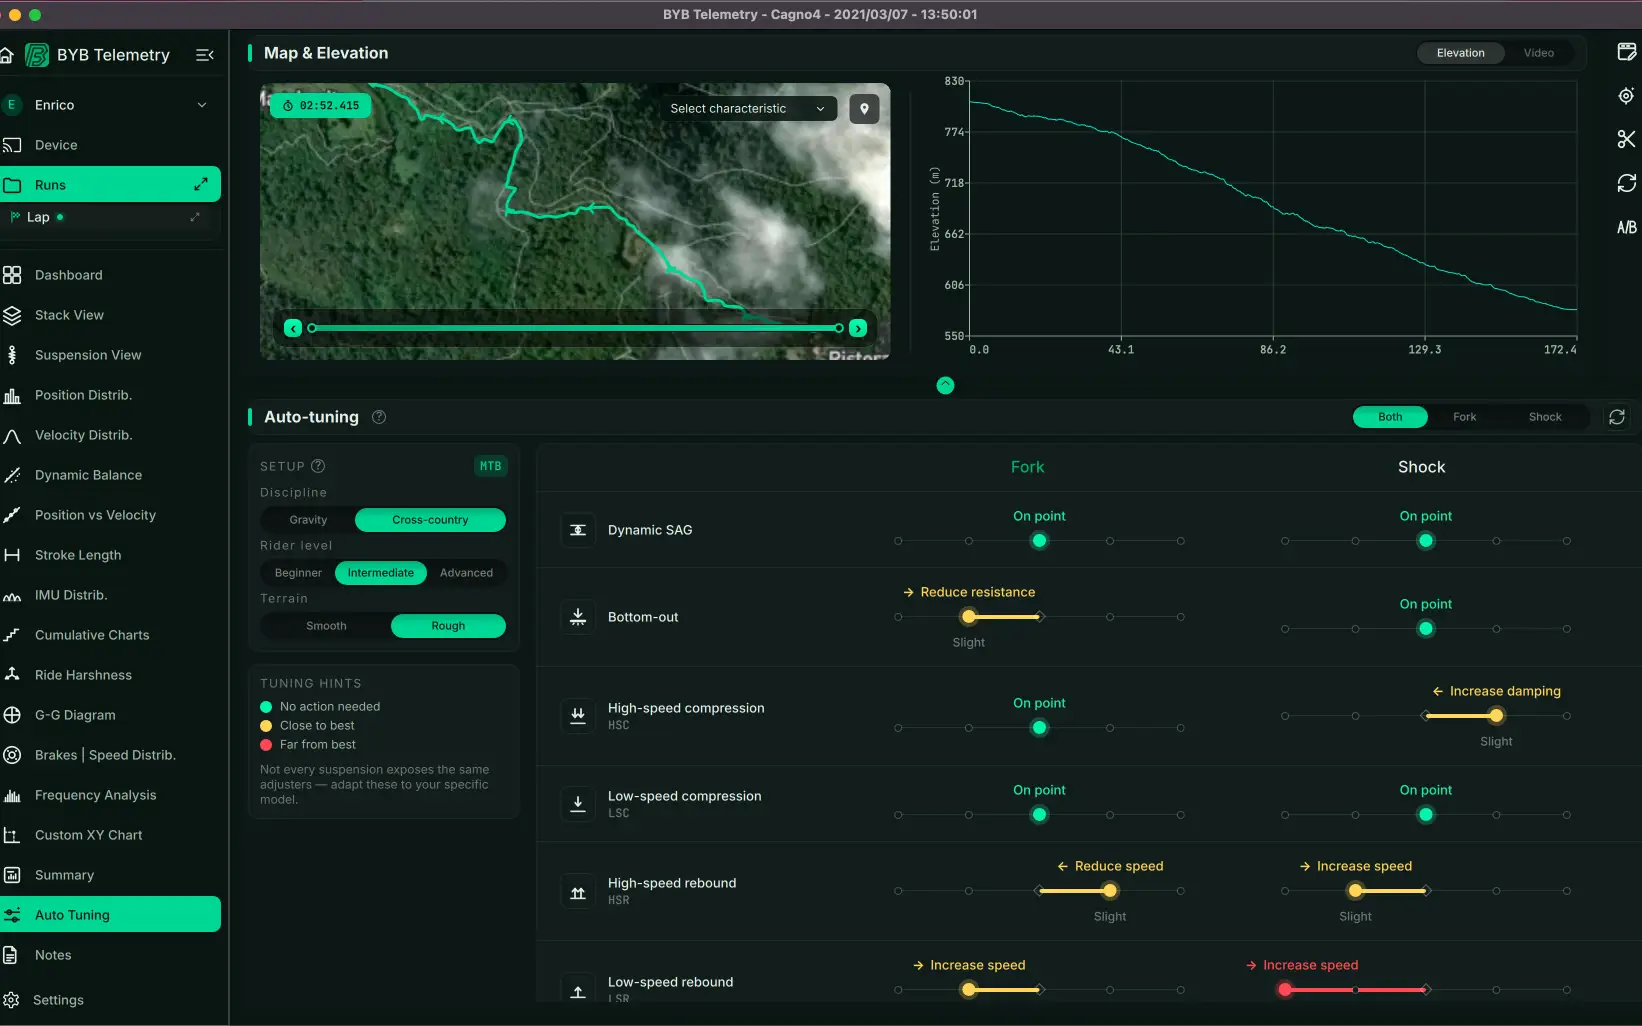
Auto tuning reads the recording and proposes where to go next on sag, bottom-out, compression and rebound — you make the change, ride again, and the next comparison says whether it worked.
where the bike settles under you, and the first thing to get right.
how often the travel runs out, and by how much when it does.
kept apart, because a fork that dives and a fork that spikes need opposite changes.
whether the suspension is keeping up with the trail or falling behind it.
Auto-tuning
Dynamic SAG
Bottom-out
High-speed compression HSC
Low-speed compression LSC
High-speed rebound HSR
Low-speed rebound LSR
Tuning hints
- No action needed
- Close to best
- Far from best
Try the auto-tuning now
You do not need to be an engineer
We made all the charts and views easy to read and fast to interpret. For everyone.
Record a baseline
One run, a trail you know, the setup you already have. Everything else is measured against it.
Change one setting
One. Change two and the comparison cannot tell you which one worked.
Compare the two runs
Side by side. Better, worse or no difference — all three are answers.
Or learn the whole method at once
BYB Tech runs an online course for riders and technicians who would rather be taught the workflow than discover it.
See the training courseThe mobile app
Capture, at the unit
The app is what you use between runs. It pairs with the unit wirelessly, so nothing comes out of a bag.
Connect and configure
Pair with the acquisition unit and change its settings without a laptop.
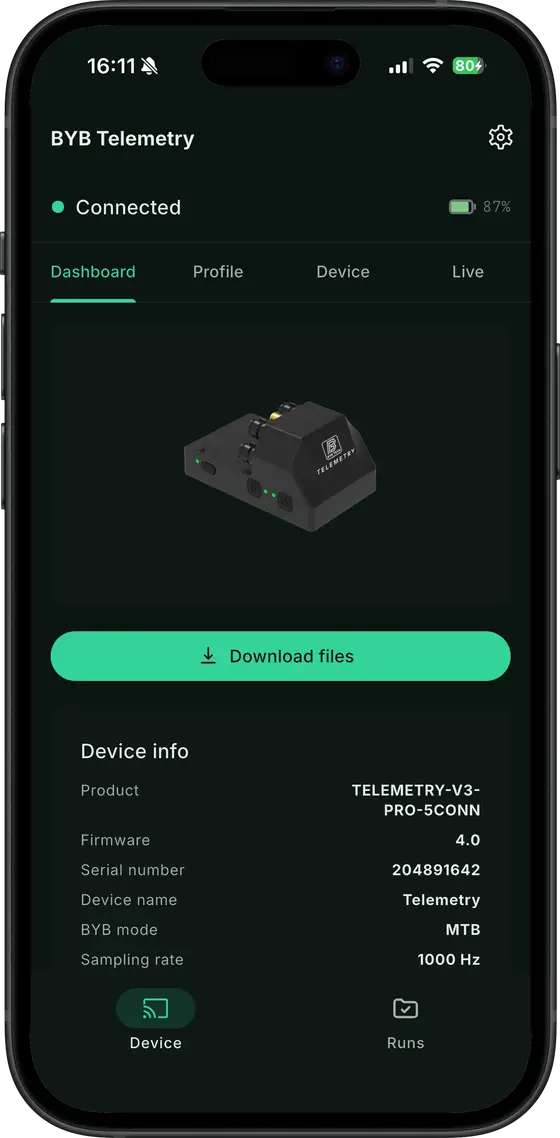
Connected, with the unit's settings in front of you and a button that pulls the runs off it. Download and manage runs
Pull a session off between motos, and share a run with a rider or a technician.
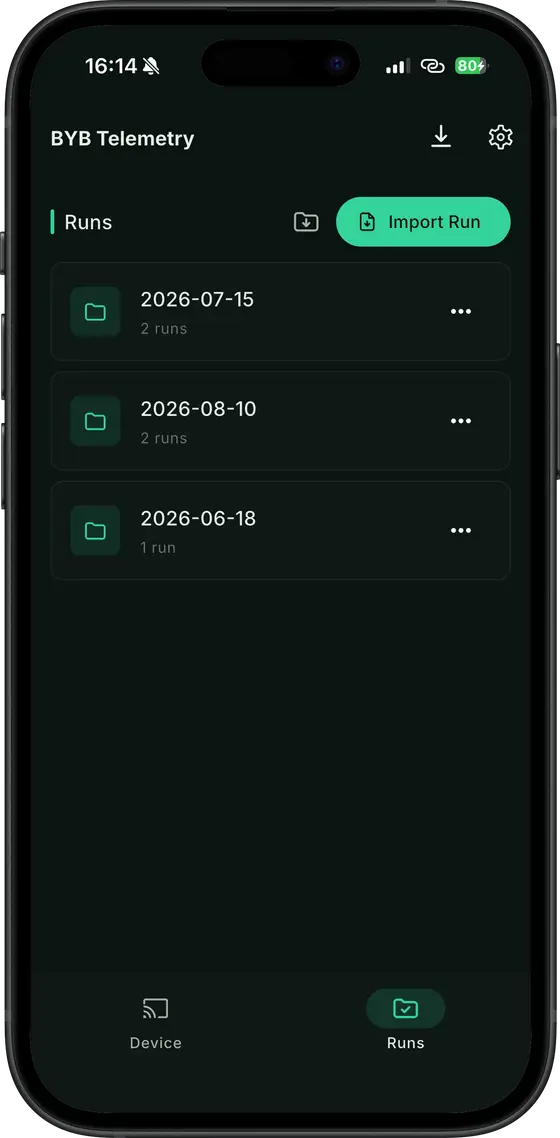
Every run filed by the day it was ridden. Import, move and share without opening a laptop. Set the leverage curve
Enter the bike's shock and wheel travel and the app works out the ratio across the stroke, then applies it to the wheel it belongs to.
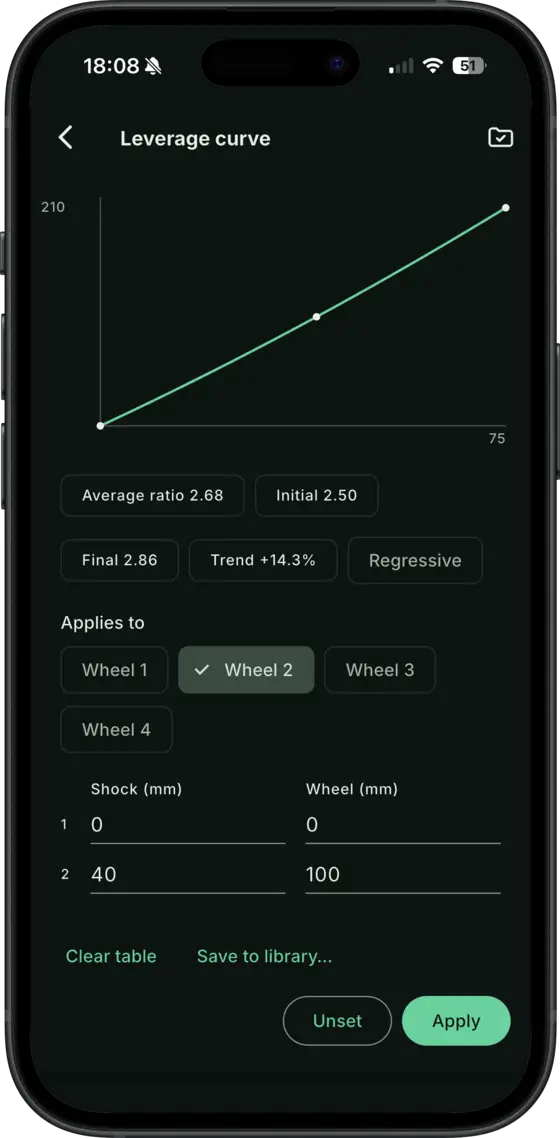
The linkage, typed in once. From there the app knows how far the wheel moves for every millimetre of shock stroke.
Review before the helmet's off
The run is on the phone before the helmet is off — a summary first, then the same channels you would open on the desktop.
Instant summaries
What the run did, with the map beside it, before you have taken your helmet off.
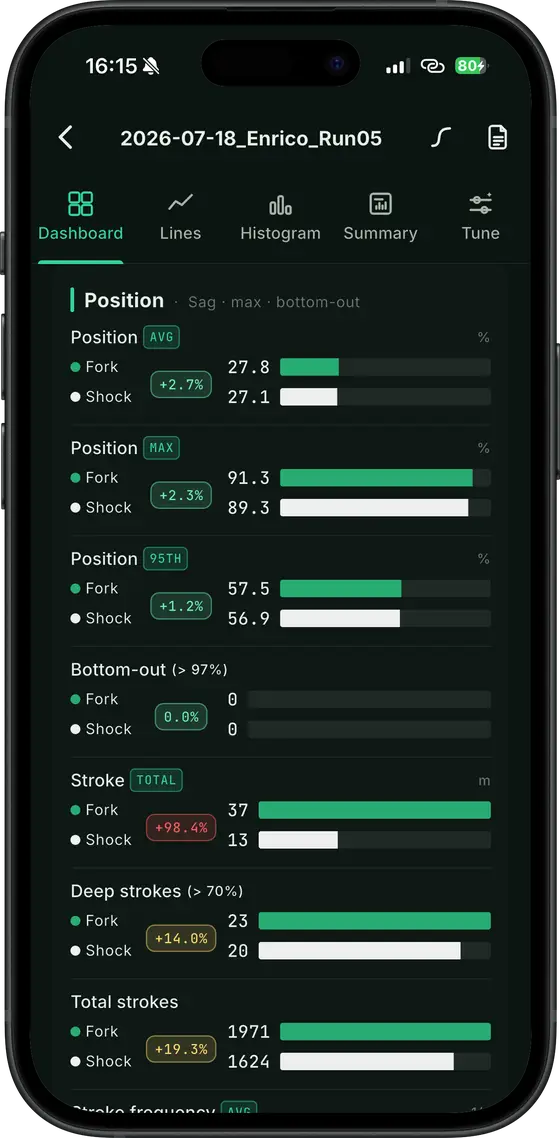
The run's numbers before the helmet is off — and how every one of them moved against the run before. Charts on the spot
Suspension, accelerometer and speed, read at the side of the track.
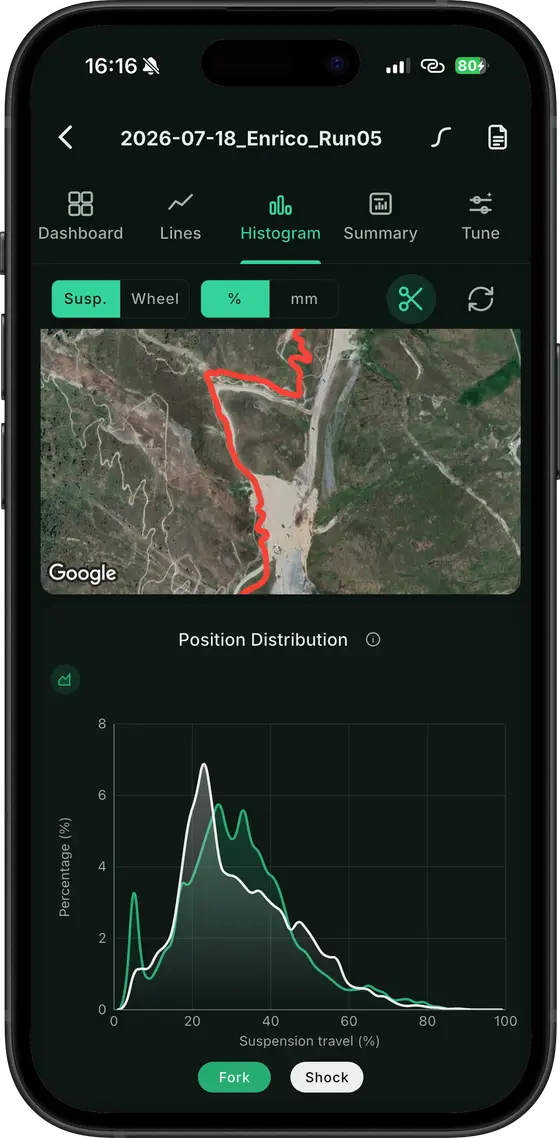
Where the suspension spent its time, fork against shock, with the piece of trail it spent it on. Lines, at the track
Fork and shock against time, with the piece of trail they came from above them — the desktop's first view, on a phone.
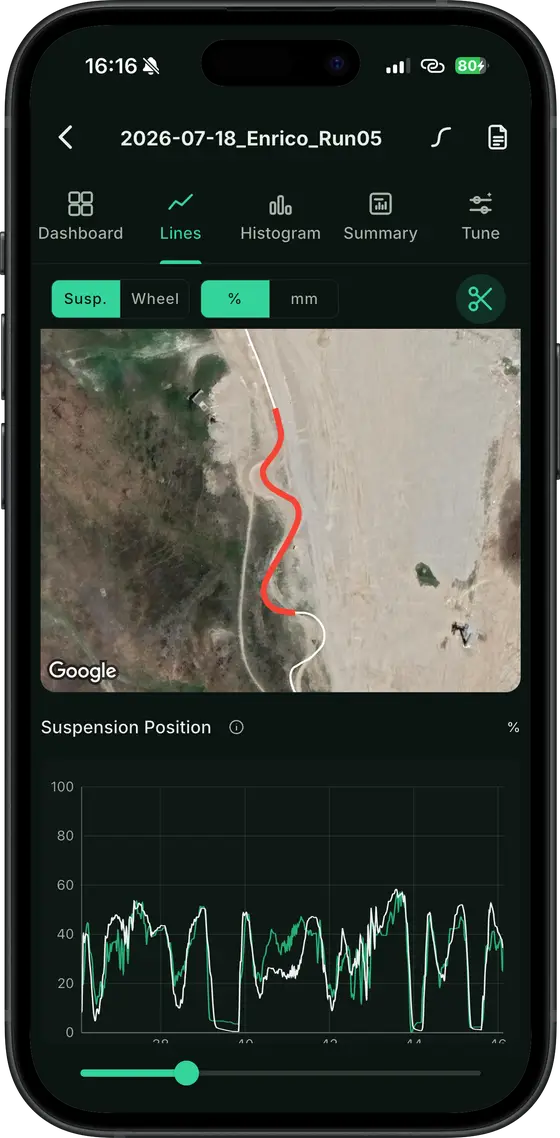
The traces the desktop draws, on the phone, minutes after the run rather than that evening.
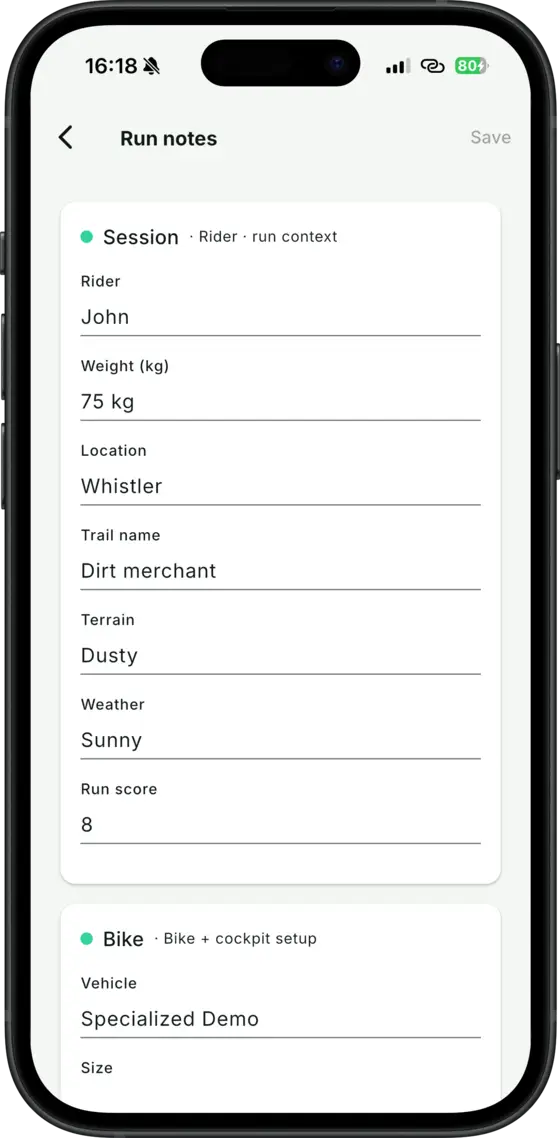
Keep the record
What you changed and what the track was like, written down once so nobody has to remember it later.
What runs where
The desktop software is where analysis happens. The app is where a session gets captured and reviewed.
| Capability | macOS | Windows | iOS | Android |
|---|---|---|---|---|
| Connect to the acquisition unit | Yes | Yes | Yes | Yes |
| Download and manage runs | Yes | Yes | Yes | Yes |
| Change device settings | — | — | Yes | Yes |
| Analysis views | Yes | Yes | No | No |
| Run comparison | Yes | Yes | No | No |
| Position and velocity distribution | Yes | Yes | No | No |
| Auto tuning | Yes | Yes | Yes | Yes |
| Share a run | — | — | Yes | Yes |
An em dash means BYB Tech has not published that capability for that platform — not that it is missing.
The words, translated
Suspension analysis has its own vocabulary. Here is the whole of it, in the words people actually use.
- Position distribution
- Where your suspension spends its time — too low, all over, or in the sweet spot.
- Velocity distribution
- How fast the suspension was moving, and whether the damping is set for the speed the trail is actually asking for.
- Sag
- How far the suspension sinks under your weight before you have hit anything.
- Bottom-out
- Running out of travel. Occasionally is correct; often is not.
- High-speed compression
- How the suspension handles a fast, sharp hit — a square edge or a root.
- Low-speed compression
- How the suspension handles a slow, heavy load — braking, a berm, a compression.
- Rebound
- How quickly the suspension comes back after it is pushed in.
- Leverage ratio
- How much the wheel moves for every millimetre the shock moves. It is why rear travel and shock stroke are different numbers.
- Stack view
- Every channel on one time axis, so you can see what happened together.
- Suspension view
- The fork and the shock plotted against time, so a spike and the moment it happened sit on the same line.
- Map characteristics
- The ridden line coloured by whatever you ask it for — speed, impact, or how fast either end was compressing or rebounding.
- Lap timing
- Gates drawn across the trail and the time between them, so a section you lost is a number rather than a feeling.
- Comparison
- Two runs against each other, so a setup change is a difference you can see instead of a memory.
- Lap manager
- Where the laps and gates you have drawn for a track are kept, so the next session is timed against the same lines.
- Linkage simulation
- What a different linkage would do to the same wheel travel, before anyone buys one.
- Frequency analysis
- Which frequencies the suspension is actually working at — the bike moving on its springs at the low end, the trail surface at the high end.
- Video overlay
- The data and the footage on one cursor, so a spike in the trace and the rock that caused it arrive in the same frame.
FAQ
Questions about the software
- Do I need to be a data engineer to use it?
- No. The method is record a baseline, change one setting, compare the two runs. Auto tuning proposes the next change, and BYB Tech runs an online course for anyone who would rather be taught the workflow than discover it.
- What does the desktop software run on?
- Mac and Windows. The analysis views, run comparison and the distribution charts are all desktop.
- Is there an app for iOS and Android?
- Yes, both. The app connects to the acquisition unit wirelessly, changes its settings, downloads and shares runs, and shows summaries, charts and a map view at the track.
- Is the BYB Telemetry software free?
- Yes. The desktop software for Mac and Windows and the app for iOS and Android are both free — no licence and no subscription — and they come with every BYB Telemetry kit.
- Can I export the raw data as CSV?
- Telemetry V3 Pro exports raw data as CSV. Telemetry V3 does not support CSV export. Both kits include the desktop software and mobile app for downloading and analysing runs.
- Can the software open Chrono runs?
- It can, at the margin. The BYB Telemetry software is built for suspension data acquisition and reads GPS-based lap and split times; Chrono remains the dedicated tool for configuring triggers and precision lap timing.
The software is the reason to record anything
It is included with every BYB Telemetry kit, on all four platforms.