Contents
SOFTWARE AND APP
User manualApp and PC software
Contents
SOFTWARE AND APP- 01Quick startFrom install to your first run on screen
- 02Installing the softwareWhat you need · Install and first launch
- 03The app and the PC softwareWhat each one is for · Where your data lives
- 04Your profile and your GarageThe rider profile · The Garage · Setups and their history
- 05Connecting to your deviceJoin the device network
- 06The session workflowBefore the session · During the session · After the session — download · Fixing a run afterwards
- 07The PC softwareThe window · Opening a run · Settings
- 08Display modes, leverage and lapsDisplay modes · What the leverage curve is · Sensor in line with the suspension unit · Sensor not in line — measuring your own curve · Plotting and saving a custom curve · Lap manager
- 09Reading a runThe tabs · Zooming and the shared selection · Map and altitude · Stack view and suspension view · The distributions · Position vs velocity, incremental and IMU charts · Summary and notes · Comparing two runs · Auto tuning
- 10Trimming and exportingTrimming a run · Raw data · PDF report
- 11Video syncBeing rewritten
- 12The app, screen by screenThe Device page · The Runs page · Reading a run on the phone · The Support page
- 13Keeping everything currentApp and PC software · Device firmware
- 14When something is wrongTroubleshooting · Support
Quick start
Install, set up once, then a loop of three actions per session.
From install to your first run on screen
- Install the software you will use.The app on your phone for the pits, the PC software on your computer for the desk — Installing the software.
- Create your rider profile.Name, date of birth, weight and height. Every run you record is filed under it — The rider profile.
- Add your vehicle to the Garage.Brand and model are mandatory; the geometry is what turns sensor movement into travel — The Garage.
- Connect to your device and send it the configuration.Connect over Wi-Fi, then load the profile and vehicle from the Garage — Join the device network and Before the session.
- Ride.The device records on its own. Neither the app nor the software needs to be running or connected.
- Connect again and download the session.Each run matches itself to the profile, the vehicle and the setup it was ridden with — After the session — download.
Installing the software
Two programs, the same work, on the two devices you already carry.
What you need
- The BYB app
- A smartphone or tablet, iOS or Android. This is the pit-side tool: it connects to the device, downloads runs and edits setups where the vehicle is.
- The BYB PC software
- A computer running Windows or macOS. The desk-side tool: the same device panel, plus everything to do with reading the data afterwards.
- Wi-Fi
- The device creates its own network and you join it. No internet connection, no router and no pairing are involved — Join the device network.
You do not need both. Either one covers the whole workflow in this manual; most people install both and use whichever is to hand.
Install and first launch
- Install the PC software from bybtech.it.Download the version for your operating system and run the installer.
- Install the app from the App Store or Google Play.Search for BYB Tech.
- Open each one once before you go to the track.First launch creates the local storage the manual refers to as your Garage and your runs.
The app and the PC software
Same data, two places to work. This is the only chapter that tells them apart.
What each one is for
The app and the PC software show the same device panel and do the same job. They differ in how much control they give you, which follows from where you use them: one hand in the pits, two hands at the desk.
| Task | App | PC software |
|---|---|---|
| Connect to a device | Yes | Yes |
| Profile, vehicle and device configuration | Yes | Yes |
| Download runs | Everything, in one tap | Run by run, into a folder you choose |
| Garage and setup history | Yes | Yes |
| Reading the data — charts, comparison, trends | Summary only | Full analysis |
Where your data lives
A run lives where you downloaded it. Downloading on the phone puts it on the phone; downloading on the computer puts it on the computer. Nothing moves between them on its own.
To move a run, export it with its setup and import it on the other side. The setup travels with the recording, so whoever opens it sees exactly the vehicle it was ridden with. Importing a run you already have adds it rather than overwriting yours.
Your profile and your Garage
Set up once. It is what lets every later run file itself.
The rider profile
The profile is who is riding: name, date of birth, weight and height. Runs and the Garage are filed under it, one profile is active at a time, and you switch it from the profile switcher on the Home page.
The Garage
The Garage holds your vehicles. Add one with "+ Add vehicle": brand and model are mandatory, because the name they make is what the device writes into every run and what the software matches back to this vehicle. Then enter the geometry — the values that turn sensor movement into suspension travel.
Which values a vehicle needs depends on the product and the kit fitted to it, and they are listed with the hardware that produces them: BYB Telemetry manual.
Setups and their history
Geometry belongs to the vehicle and changes when a part changes. Everything you adjust between runs — clickers, pressures, spring, tyre — is a setup: save it in the Garage before you ride, and each save adds a dated line to that vehicle’s history. When you download a run, the setup that was current when it started is assigned to it automatically.
Connecting to your device
One Wi-Fi network. Configuration, downloads and firmware all go through it.
Join the device network
A BYB device does not join your network — it creates its own, and your phone or computer joins that. Put the device into connection mode, pick its network in the Wi-Fi list, and open the app or the software.
- Put the device into connection mode.The button and the LED that do this are per product — BYB Telemetry manual.
- On your phone or computer, join the device’s network from the Wi-Fi list.The network name and password are printed in the product’s own manual.
- Ignore any warning that the network has no internet."Connected without internet" is the correct state: the device is not a router.
- Open the app or the PC software. It finds the device on its own.
The session workflow
Three actions, in this order, every session day.
Before the session
- In the Garage, select the vehicle you are about to ride.
- Save today’s setup, if you have changed anything on the vehicle.A setup applies from its date onward — Setups and their history.
- Connect to the device — Join the device network.
- In the device panel, open Profiles and use "Load from Garage…" to send the profile and vehicle to the device.The device stores one configuration at a time: the last one sent.
- Check the panel header — it names the device, its firmware and its battery level.
During the session
Nothing. The device records on its own, and the app is not part of the recording — leave the phone in the van. Starting and stopping a run, and what the LEDs mean while it happens, are in the product’s own manual.
After the session — download
- Connect to the device — Join the device network.
- Open the device panel.The app opens on it; in the PC software it is the Device button in the top bar.
- Download the runs.In the app, tap Download files.In the PC software, tick the runs you want and press Download selected. Leave "Download into" on Auto and runs are filed by rider.
- Check that each run arrived with its vehicle and setup.A run that matched nothing is imported anyway, without a vehicle; assign it with a right-click on the run — Fixing a run afterwards.
What to do with the runs once they are on the computer starts at Reading a run.
Fixing a run afterwards
Attribution misses cost you the automatic link, never the data. Every correction is on the run row.
| Problem | Fix |
|---|---|
| Wrong or missing vehicle | Run row, "Assign vehicle…". Several at once: select the runs, then Assign vehicle. |
| Wrong setup | Run row, "Assign specific setup…", then pick from that vehicle’s setups, newest first. |
| The run predates every setup | Correct the history rather than the run: edit the setup’s date, or add one, then assign it. |
| There genuinely was no setup | Mark "No setup for this run". The run stops asking. |
The PC software
Where things are on screen, and the two settings worth fixing before the first run.
The window
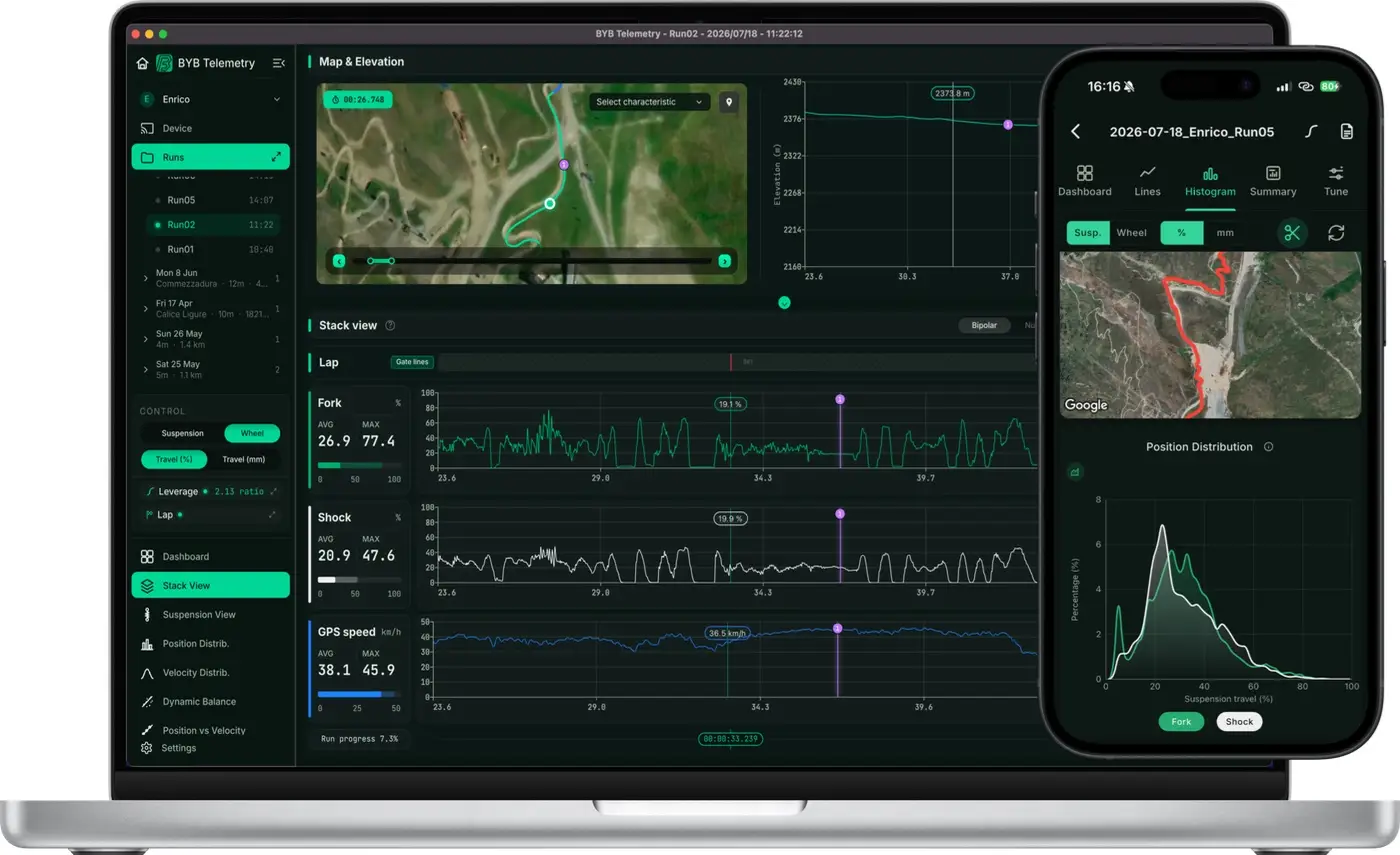
The window is divided into six regions. This chapter and the two after it follow them in order:
- Menu bar — file, export, report and update commands.
- File browser — your runs, as folders on disk.
- Control panel — how the data is displayed.
- Tab selector — which analysis you are looking at.
- GPS and altitude charts — always on screen, above the tabs.
- Tabs — the analysis itself.
Opening a run
The file browser opens on your root folder and lists what is inside it. Click a folder to go in, the arrow at the top to go back, and a .byb file to open the run.
Settings
Two settings are worth fixing before you open the first run. Both are in Settings, in the top menu bar; press Apply when you are done.
- Root path
- The folder the file browser opens on. Point it at the folder that holds all your .byb files — it is loaded again at every startup.
- Sensor lengths
- The stroke of the sensors fitted. The data is scaled to these values and the automatic calibration depends on them, so a wrong length makes every chart wrong by the same factor.
| Mode | Front suspension | Rear suspension |
|---|---|---|
| MTB | 210 mm | 80 mm |
| MOTO | 350 mm | 150 mm |
Display modes, leverage and laps
The control panel decides what every chart in every tab is showing.
Display modes
The control panel highlights the modes currently active. Change one and every chart in every tab updates with it.
| Control | What it does |
|---|---|
| Suspension | Charts show suspension travel — what the sensor measured. |
| Wheel | Charts show wheel travel — what the wheel did, through the leverage ratio. |
| Travel (%) | Values as a percentage of the travel available. |
| Travel (mm) | Values in millimetres. |
| Leverage | Applies the leverage curve of the vehicle. |
| Lap manager | Turns on lap times and time splits. |
The values the panel works from are loaded out of the run itself. If one of them is wrong, correct it in the Notes tab, save, and open the run again.
What the leverage curve is
The leverage chart plots rear wheel travel along the horizontal axis against rear suspension stroke up the vertical one. The curve between them is the leverage ratio, and it is unique to the frame: it is what turns the stroke the sensor measured into the travel the wheel actually made.
- Computed leverage
- Wheel travel against the stroke of the suspension unit — the frame’s own kinematics, the curve a manufacturer or a linkage program produces.
- Installed leverage
- Wheel travel against the stroke of the sensor as it is actually mounted. With the sensor in line with the suspension unit the two are the same curve. Mounted anywhere else they are not, and the installed one is the one the software needs.
So the mounting decides the method. A sensor in line with the suspension unit measures the unit’s own stroke, and any of the three ways in Sensor in line with the suspension unit gives a correct curve. A sensor mounted anywhere else measures its own stroke and nothing published relates it to the wheel, so the curve has to be measured on the vehicle — Sensor not in line — measuring your own curve.
Sensor in line with the suspension unit
Three ways to get the curve, in order of effort. All three end up in the same place, so start at the top and go down only if you need to.
- Click Wheel
- The values already entered for the vehicle — maximum suspension travel and maximum wheel travel — are enough for a linear interpolation between them, and the software builds the suspension-to-wheel relationship from those two numbers alone. Nothing to measure and nothing to fill in.
- Take it from the library
- Pick your vehicle from the BYB library of pre-computed leverage ratios, where it is available. The real curve of that frame, with none of the work.
- Fill the table yourself
- Enter the pairs by hand, from 0, 0 up to maximum suspension travel and maximum wheel travel, and the curve is interpolated through them — Plotting and saving a custom curve.
Sensor not in line — measuring your own curve
Here the published curve is no use: it describes a suspension unit the software is not reading. What you need is pairs of the sensor’s own stroke and the wheel travel that goes with it, measured on the vehicle — the installed leverage.
- Mount the sensor on the rear triangle, connected to the main frame.The relative movement between the two must stay inside the sensor’s range: at the vehicle’s maximum travel the sensor must be at its maximum too, and it must not describe an arc.
- Measure the two ends: sensor stroke and wheel travel at full extension, and again at full compression.
- Measure two or three more pairs spread across the travel.Two to five points in total. More points is a better curve only for as long as every one of them is measured carefully.
- Write each stroke down with the wheel travel that belongs to it.Off-line mountings give a curve that looks nothing like the frame’s published one — flatter, steeper, or bent the other way. That is the sensor’s geometry on top of the frame’s, and it is what you want.
- Enter the measured sensor stroke in the vehicle configuration.Sensor travel stays whatever the sensor is — 80 mm, for example — and rear wheel travel is the total travel of the vehicle. The values live with the vehicle in The Garage.
Then enter the pairs and interpolate them like any other custom curve — Plotting and saving a custom curve.
Plotting and saving a custom curve
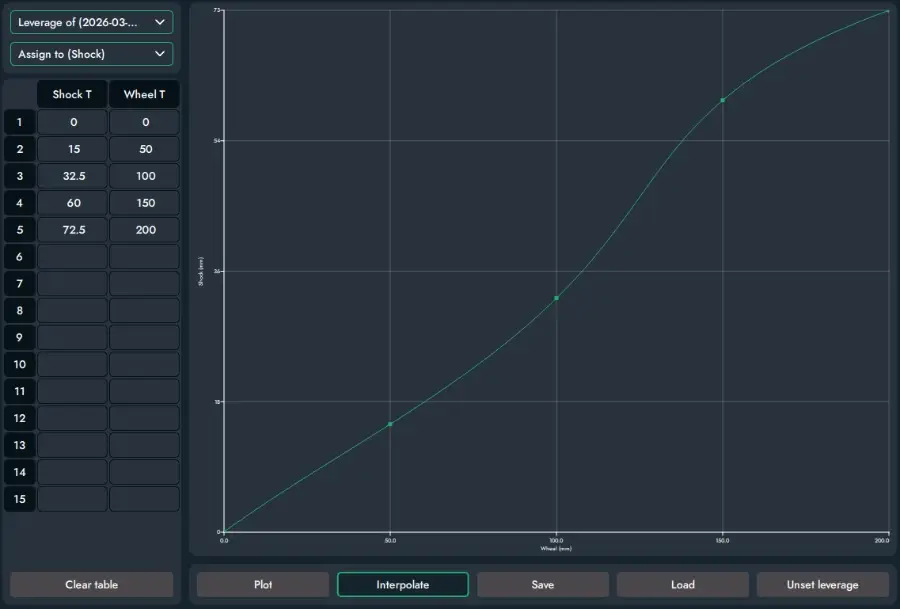
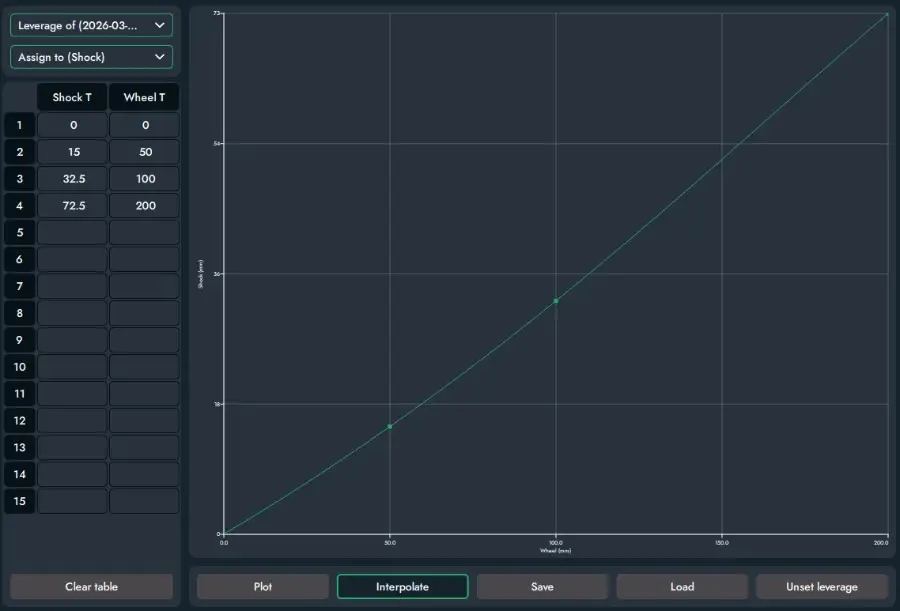
- Select Leverage in the control panel.The table and the chart open together. The dropdowns at the top choose which saved curve you are editing and which channel it is assigned to.
- Enter each pair in the table — Shock T, Wheel T — from the minimum upward.Start at 0, 0 and finish at maximum stroke, maximum wheel travel.
- Press Plot to draw the points.
- Press Interpolate to generate the curve.
- Look at the shape before you trust it.A leverage curve is smooth and consistent. A wobble in it is a measurement, not a frame.
- Remove the points that disagree with their neighbours, and interpolate again.
- Save the curve.Save and Load keep one curve per vehicle. Unset leverage removes it and goes back to linear.
Lap manager
The lap manager turns the GPS trace into times: an open lap for a point-to-point track, a closed lap for a circuit.
- Open Lap manager from the control panel.
- Choose open lap or closed lap.An open lap has a start line and a finish line. A closed lap has one start/finish line.
- Draw the lines on the map.
- Add splits wherever you want an intermediate time.
- Click Apply.Stack view and suspension view update with the new selection.
- Save the lines to a file.Load puts the same lines on another run. Toggle leaves lap mode.
Reading a run
One run, a dozen views of it. Every tab follows the control panel and the current selection.
The tabs
| Tab | What it shows |
|---|---|
| Stack view | Every chart stacked on one time axis. |
| Suspension view | The same data in detail, chart by chart. |
| Position distribution | How long the suspension spent at each point of its travel. |
| Velocity distribution | How long the suspension spent at each shaft velocity. |
| Stroke length | Compression and rebound events by length, and deep-stroke count. |
| IMU distribution | Accelerometer and gyroscope, three axes each. |
| Brake distribution | How long the brakes were pulled. |
| Speed distribution | How long each speed was held. |
| Position vs velocity | Suspension position plotted against suspension velocity. |
| Incremental charts | Cumulative suspension and IMU values. |
| IMU charts | IMU data beside suspension position and velocity. |
| Summary | The run in numbers. |
| Comparison | Two runs from the same track, and the gain or loss between them. |
| Auto tuning | A setup suggestion from the recorded data. |
| Notes | The settings and notes the run carries. |
Zooming and the shared selection
Click, drag and release on any chart to zoom into that interval. The same interval is highlighted on the GPS track, the average and maximum values beside the chart update, and the selection is shared between tabs — so a section chosen in the stack view is the section every other tab reports on. Double-click anywhere on a chart to zoom back out.
Map and altitude
The GPS map loads with the run. The route is drawn on it and a dot follows the cursor as it scrolls through the data. Zoom with the mouse wheel, move with the arrows.
The route can be coloured by a characteristic: pick one from the dropdown and the whole trace becomes a gradient of that value along the track — where the speed was, where the travel went.
The altitude chart under it shows the vertical drop. Steepness is calculated from the GPS data and is approximate: negative values are descents, positive values are climbs.
Stack view and suspension view
Stack view puts every available chart one above another on a shared time axis — suspension movement, speed from both sources, brakes, IMU. It is where you see how they relate: what the suspension did while the brakes were on, and what the speed did after it.
Suspension view is the same data in detail, one chart at a time, with pointer labels reading the value under the cursor and controls for which lines are drawn and how they overlay.
The distributions
Five tabs answer the same question in different currencies: how much of the run was spent where. They are histograms, and they all follow the control panel and the current selection.
- Position distribution
- How long the suspension spent at each point of its travel — the balance check. Plot wheel travel rather than suspension travel, since the leverage ratio makes the two different. The scatter beside it carries a median line and a best-fit line for a perfectly balanced vehicle.
- Velocity distribution
- How long the suspension spent at each shaft velocity — the same check, dynamically.
- Stroke length
- How many compression and rebound events happened at each length, and a count of the deep ones: a single event using more than 70% of the travel.
- IMU distribution
- Accelerometer and gyroscope over three axes each. The accelerometer shows the impacts taken, the gyroscope the pitch, roll and yaw. Read both against how the unit is installed.
- Brake and speed distribution
- How long the brake levers were pulled, and how long each speed was held. GPS speed and sensor speed differ — GPS is the less accurate of the two and depends on reception.
Position vs velocity, incremental and IMU charts
Position vs velocity plots the two against each other, which is how stroke usage, balance and the peak compression and rebound velocities are read at a glance. Click any point to see when it happened.
Incremental charts are the cumulative sum of the suspension and IMU points — the place an unexpected drift in a channel shows up. IMU charts put the accelerometer and gyroscope beside suspension position and velocity, with a sub-tab for each.
Summary and notes
Summary is the run in numbers, without going through the charts to get them; with sync on it describes the current selection instead. Notes holds the settings the run was recorded with — the fields are editable, and Save writes them back into the run.
Comparing two runs
Comparison puts two runs from the same track together. The software builds a distance axis for both, plots the data of each in the top chart, and shows the gain or loss of the first against the second below it.
It is the tool for finding where a change actually paid — section by section, rather than as one number over a whole run — and it carries sub-tabs for the other channels, so a time gain can be traced back to what the suspension was doing there. Distance is calculated from the speed sensor or from GPS, whichever you select.
Auto tuning
Auto tuning reads the run against the rider level you select and suggests where the setup should move. Press Tune, and the direction to go is written under each dot. With sync on, it reads the current selection instead of the whole run.
The suggestions are a direction, not a click count: translate them to the vehicle in front of you, and change one thing at a time so the next run says whether it worked.
Trimming and exporting
Cutting a run down, and getting data out of the software.
Trimming a run
A recording that starts in the pits and ends at the van is mostly not the run. Trimming writes a new .byb file from a selection and leaves the original untouched.
- Select the interval in stack view or suspension view.
- File > Save selection as new .byb.The new file carries the notes and all the original information.
File > Save selection without stops as new .byb does the same and drops every point recorded below 6 km/h, which removes the pauses inside a run rather than at its ends.
Raw data
Export > Export raw data as text writes a .csv of the acquired points: one column per channel, each with a header naming it, unprocessed, for analysis in your own tools. With an interval selected, only that interval is written.
PDF report
Report > Export report as .pdf writes the run up as a document — the relevant charts and numbers in one file, to keep with the setup sheet or send to someone who does not have the software.
Video sync
Run data overlaid on video of the run.
Being rewritten
The video sync workflow has changed, and this chapter is being written against the current one. It is deliberately short rather than wrong: the previous procedure went through a third-party tool and no longer matches what the software does.
Until it lands, ask info@bybtech.it for the current steps.
The app, screen by screen
The pit-side tool: what is on each screen, and where.
The Device page
The Device page is the unit as the app sees it. Refresh, at the top right, re-reads it; the dashboard then names the device, its BYB mode, its sampling rate and sampling mode, its battery level, its serial number and its firmware version.
The download button opens the list of runs stored on the unit, each with Download and Delete beside it. The workflow around it is After the session — download.
Config changes the unit itself: its name and network password, the BYB mode, the sampling rate, the sampling mode, and the two destructive commands — Format SD and Factory reset. What each setting does belongs to the unit rather than to the app: BYB Telemetry manual.
The Runs page
Runs holds what you have downloaded, in a folder per day. Folders and runs can be renamed, a run can be deleted, and a run can be shared out of the app or pushed to the Dropbox folder your computer reads — the cloud icon turns green once Dropbox is signed in.
Opening a run takes a few seconds. The app is processing the whole recording, and there is a lot of it.
Reading a run on the phone
A run opens on four tabs. Suspension / Wheel and % / mm switch the view inside each of them, exactly as the control panel does on the computer.
- Summary
- The run in numbers: GPS map, altitude chart, run data, suspension data, brake data.
- Lines
- GPS map, suspension position and velocity, accelerometer, brakes and speed on a shared time axis. The slider at the bottom moves the axis — drag it to the end to take in the whole run.
- Histogram
- Position, velocity and speed distributions, and the scatter plot.
- Tune
- The same automatic tuning as the computer: pick the rider level, press Tune, read the direction under each dot.
The charts are lighter than the ones on the computer, deliberately: a phone cannot draw a full run at full resolution and stay usable. For the full analysis, download to the computer — The app and the PC software.
The Support page
Support carries the addresses you might need from the pits: info@bybtech.it, this manual, the product manuals, the website and the store.
Keeping everything current
Two things update: the programs, and the device they talk to.
App and PC software
The app updates through the store like any other app. The PC software checks for a new version every time it starts with an internet connection, and tells you when one is found. Check by hand at any time with "Check for updates" in the main menu.
Device firmware
Firmware is pushed to the device from the app or the PC software over the same Wi-Fi connection, and the procedure belongs to the device: BYB Telemetry manual.
When something is wrong
The four failures that account for almost every support message.
Troubleshooting
| Symptom | What to check |
|---|---|
| The device network is not in the Wi-Fi list | The device is not in connection mode, or it is out of range. Put it back into connection mode and refresh the list. |
| Connected, but the app does not find the device | The phone has fallen back to mobile data. Disable mobile data for the moment, or allow the connection without internet. |
| Runs downloaded with no vehicle | The device carried a name that matches no vehicle in the Garage. Assign them — Fixing a run afterwards — and send the configuration next time — Before the session. |
| A run asks for a missing value every time it loads | The vehicle’s geometry is incomplete. Fill it in on the vehicle — The Garage. |
| The phone refuses the device network for having no internet | Open that network’s Wi-Fi settings, set the IP to static and enter 192.168.1.1. |
Support
Anything this manual does not answer: info@bybtech.it. Tell us which program and version you are using, which device, and what the device panel header shows — that is usually enough to answer in one reply.