Learn
Suspension data acquisition, explained by the people who build the hardware. Each guide answers one question with measurements from real runs, real screenshots of the software, and figures taken from the products rather than from a brochure. No guide states a number nobody recorded.
Browse
2 guides · Clear filters
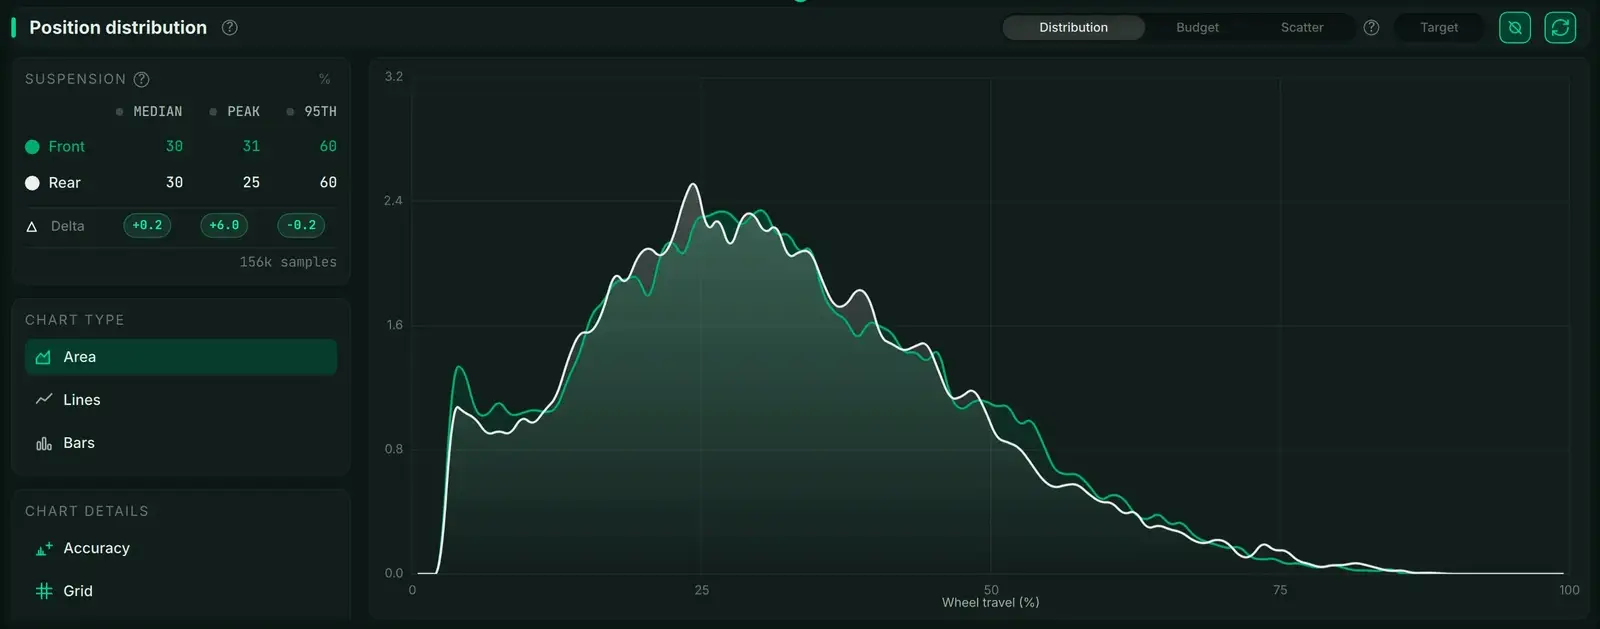
How to read a suspension travel histogram
A suspension travel histogram shows how much of a run the fork and shock spent at each point in their stroke, and its shape says whether the setup is right.
Reading the data3 min read
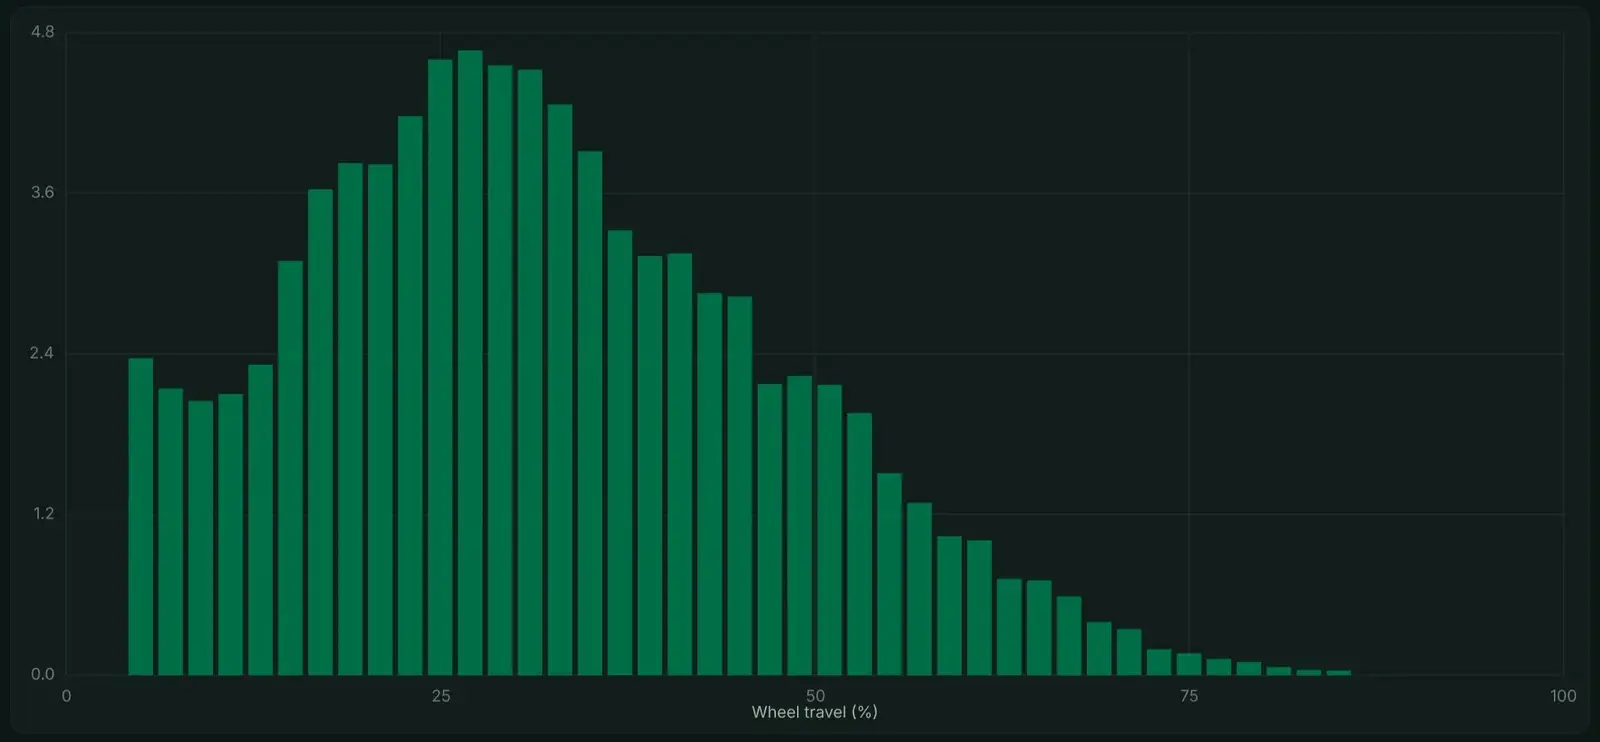
Fork bottoming out: when it is normal
When fork bottoming out is normal and when it is not: how often is too often, what a recorded run shows at the end of the stroke, and how to fix it in steps.
Reading the data3 min read
Video tutorials
Training course
3 chapters play free, without an account.