Data acquisition, or DAQ, is borrowed from motorsport. Sensors capture physical signals — suspension position, wheel speed, GPS and g-forces — and store them as time-stamped data you can replay and analyse. In mountain biking the focus is suspension: how far, how fast and how often your fork and shock move.
The point is objectivity. Two riders feel the same run differently, but the data shows exactly what the suspension did, which makes a setup repeatable instead of a matter of opinion.
Data acquisition does not replace rider feedback; it explains it. When a run feels harsh, the histogram and velocity traces usually show why.
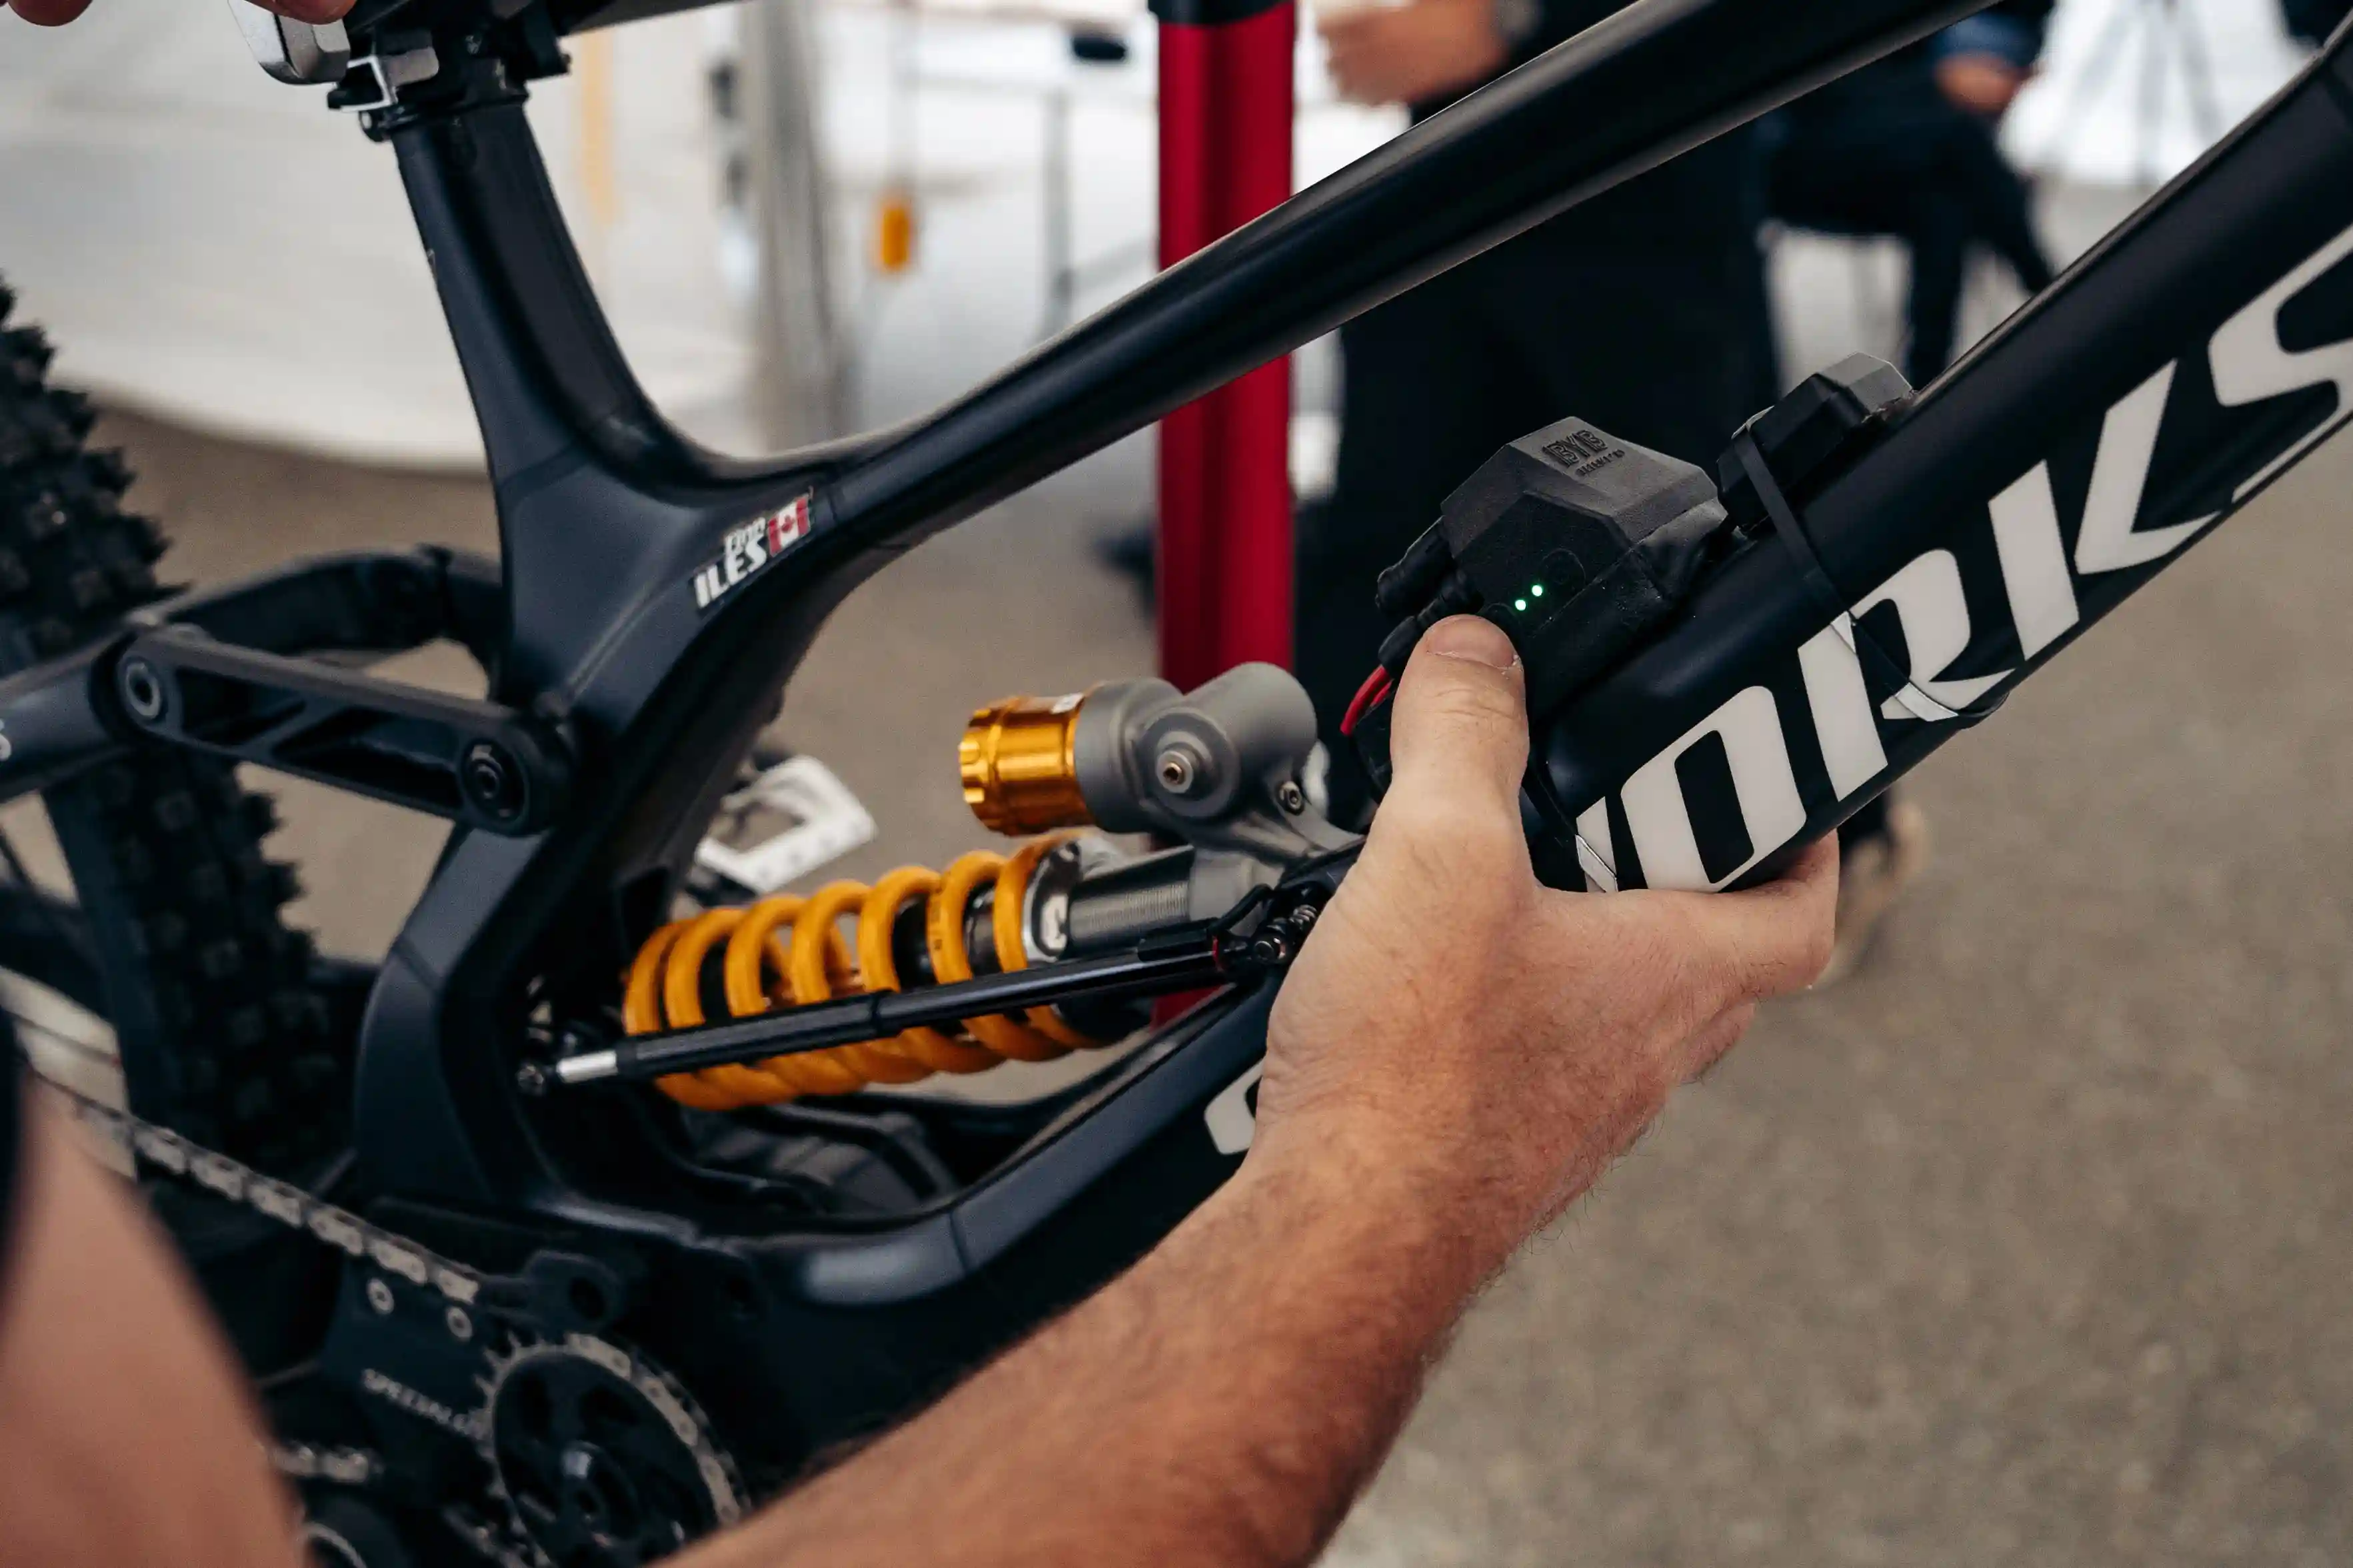
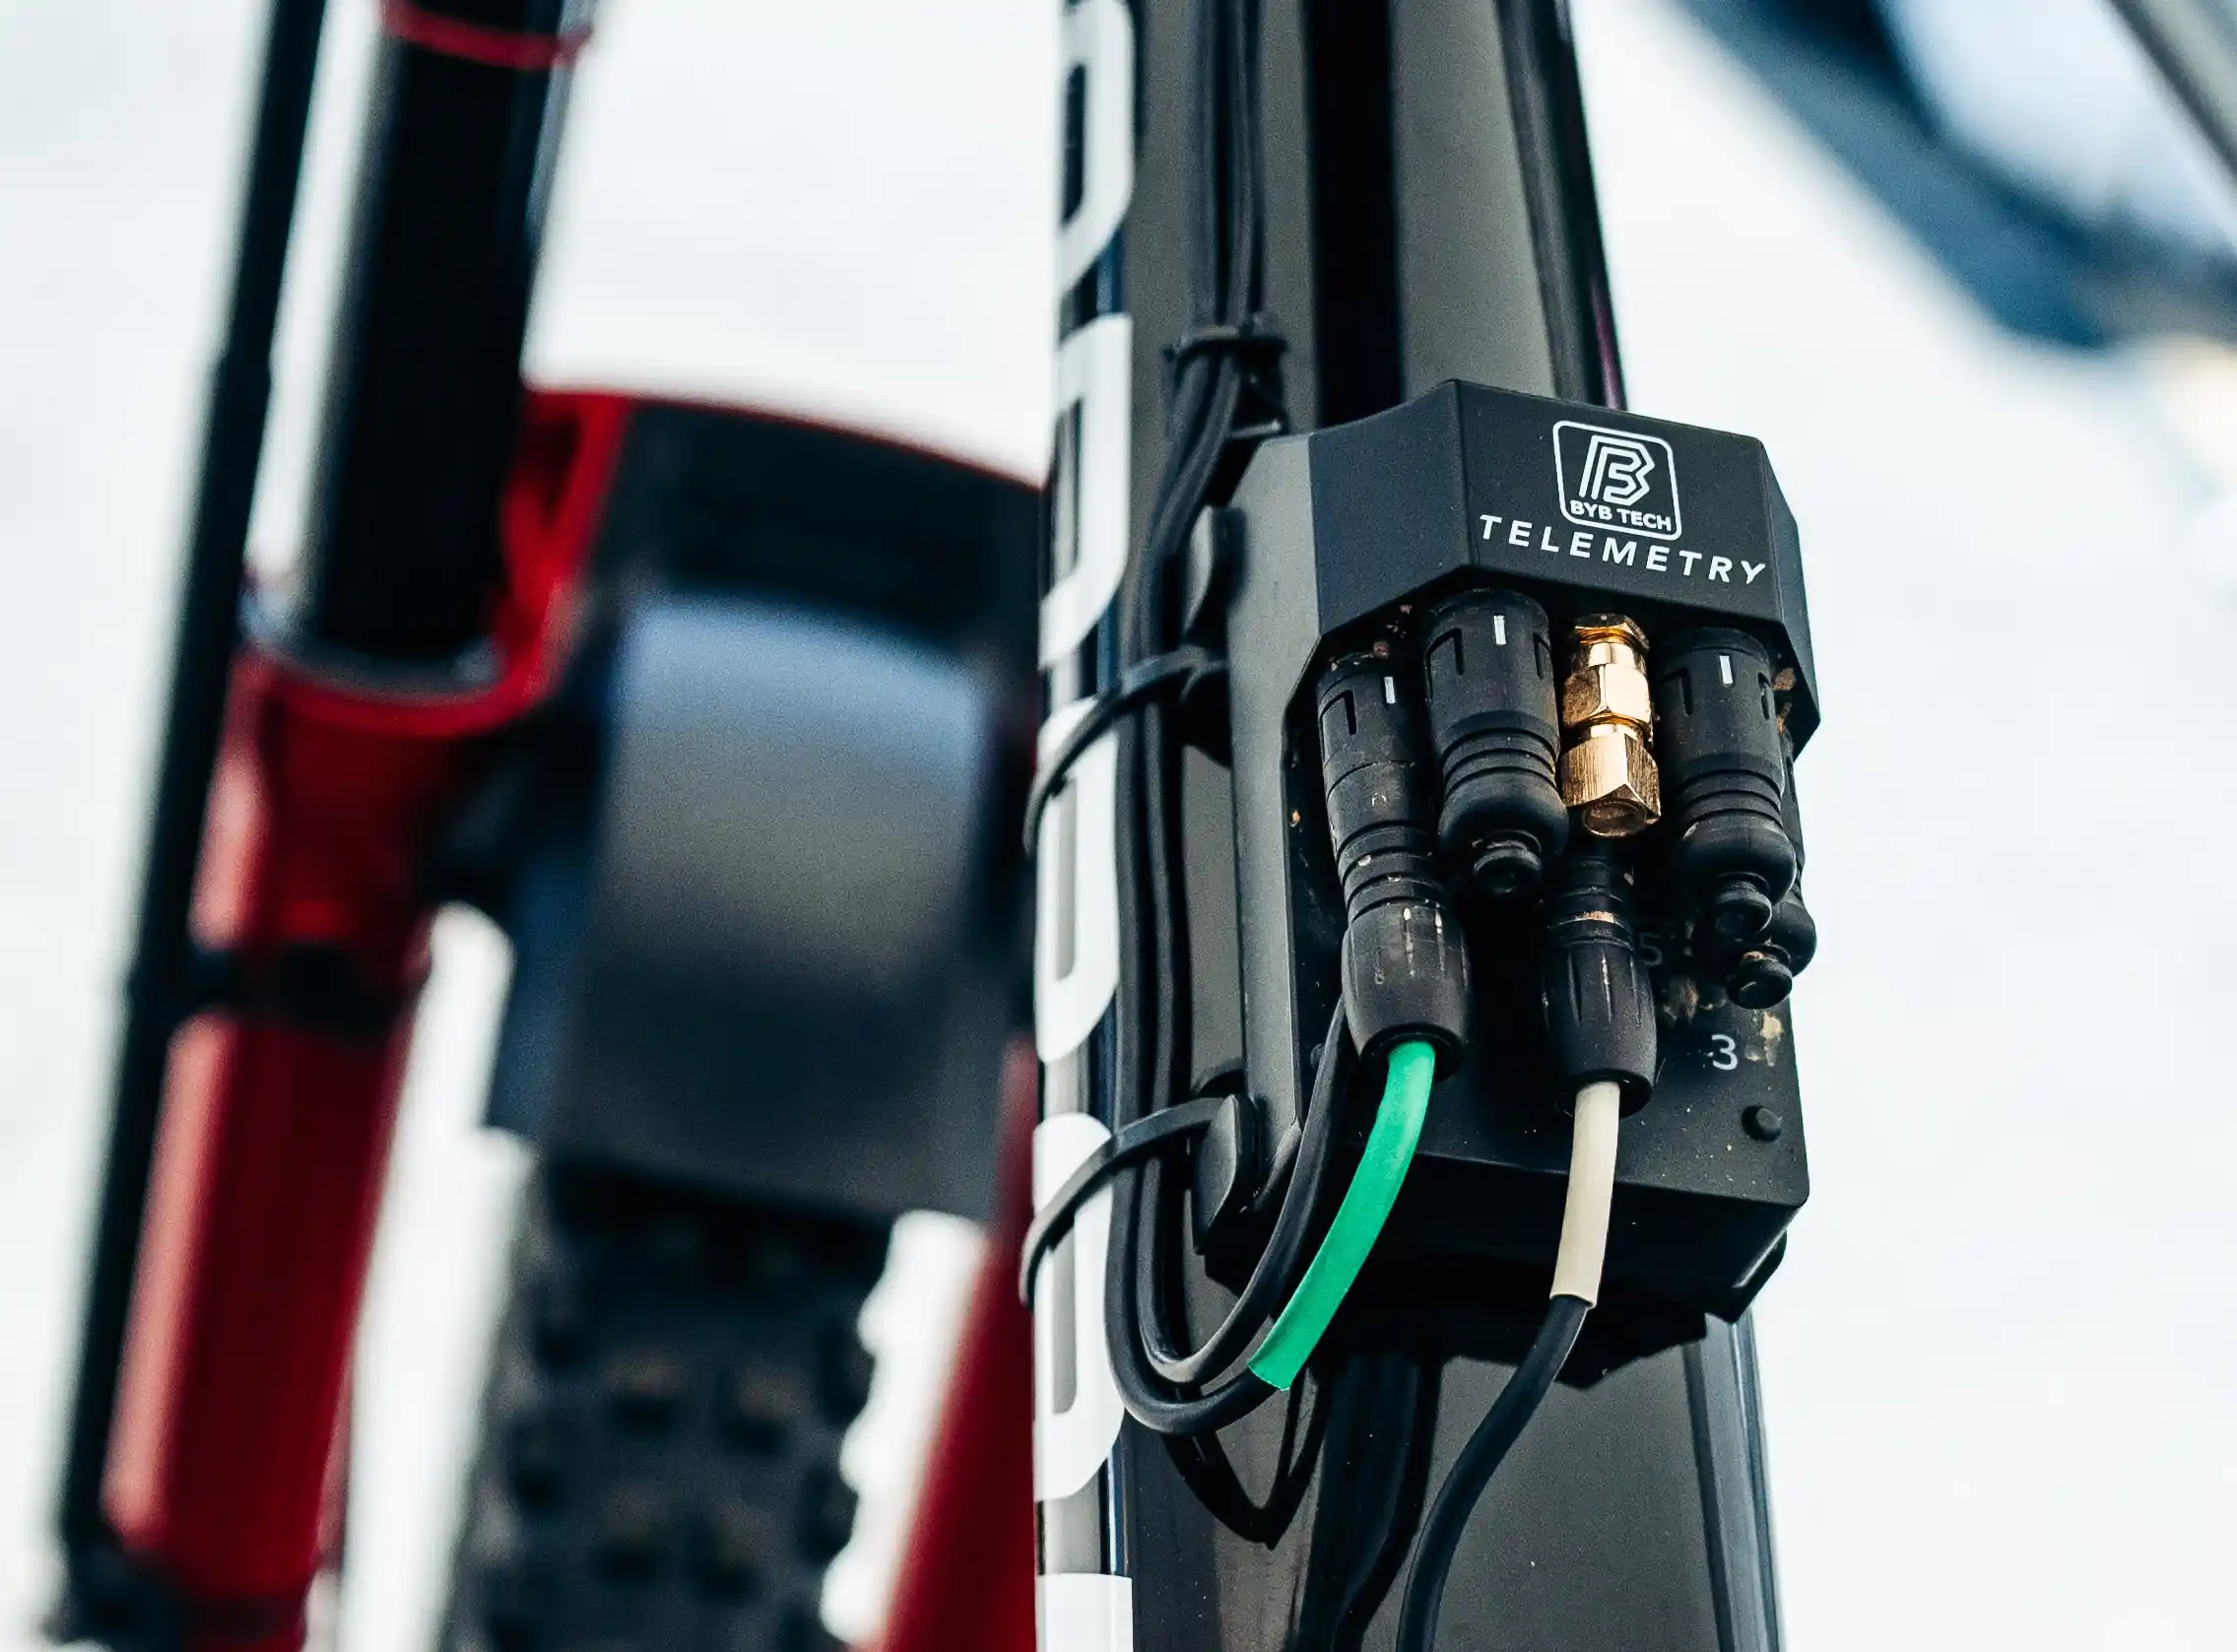
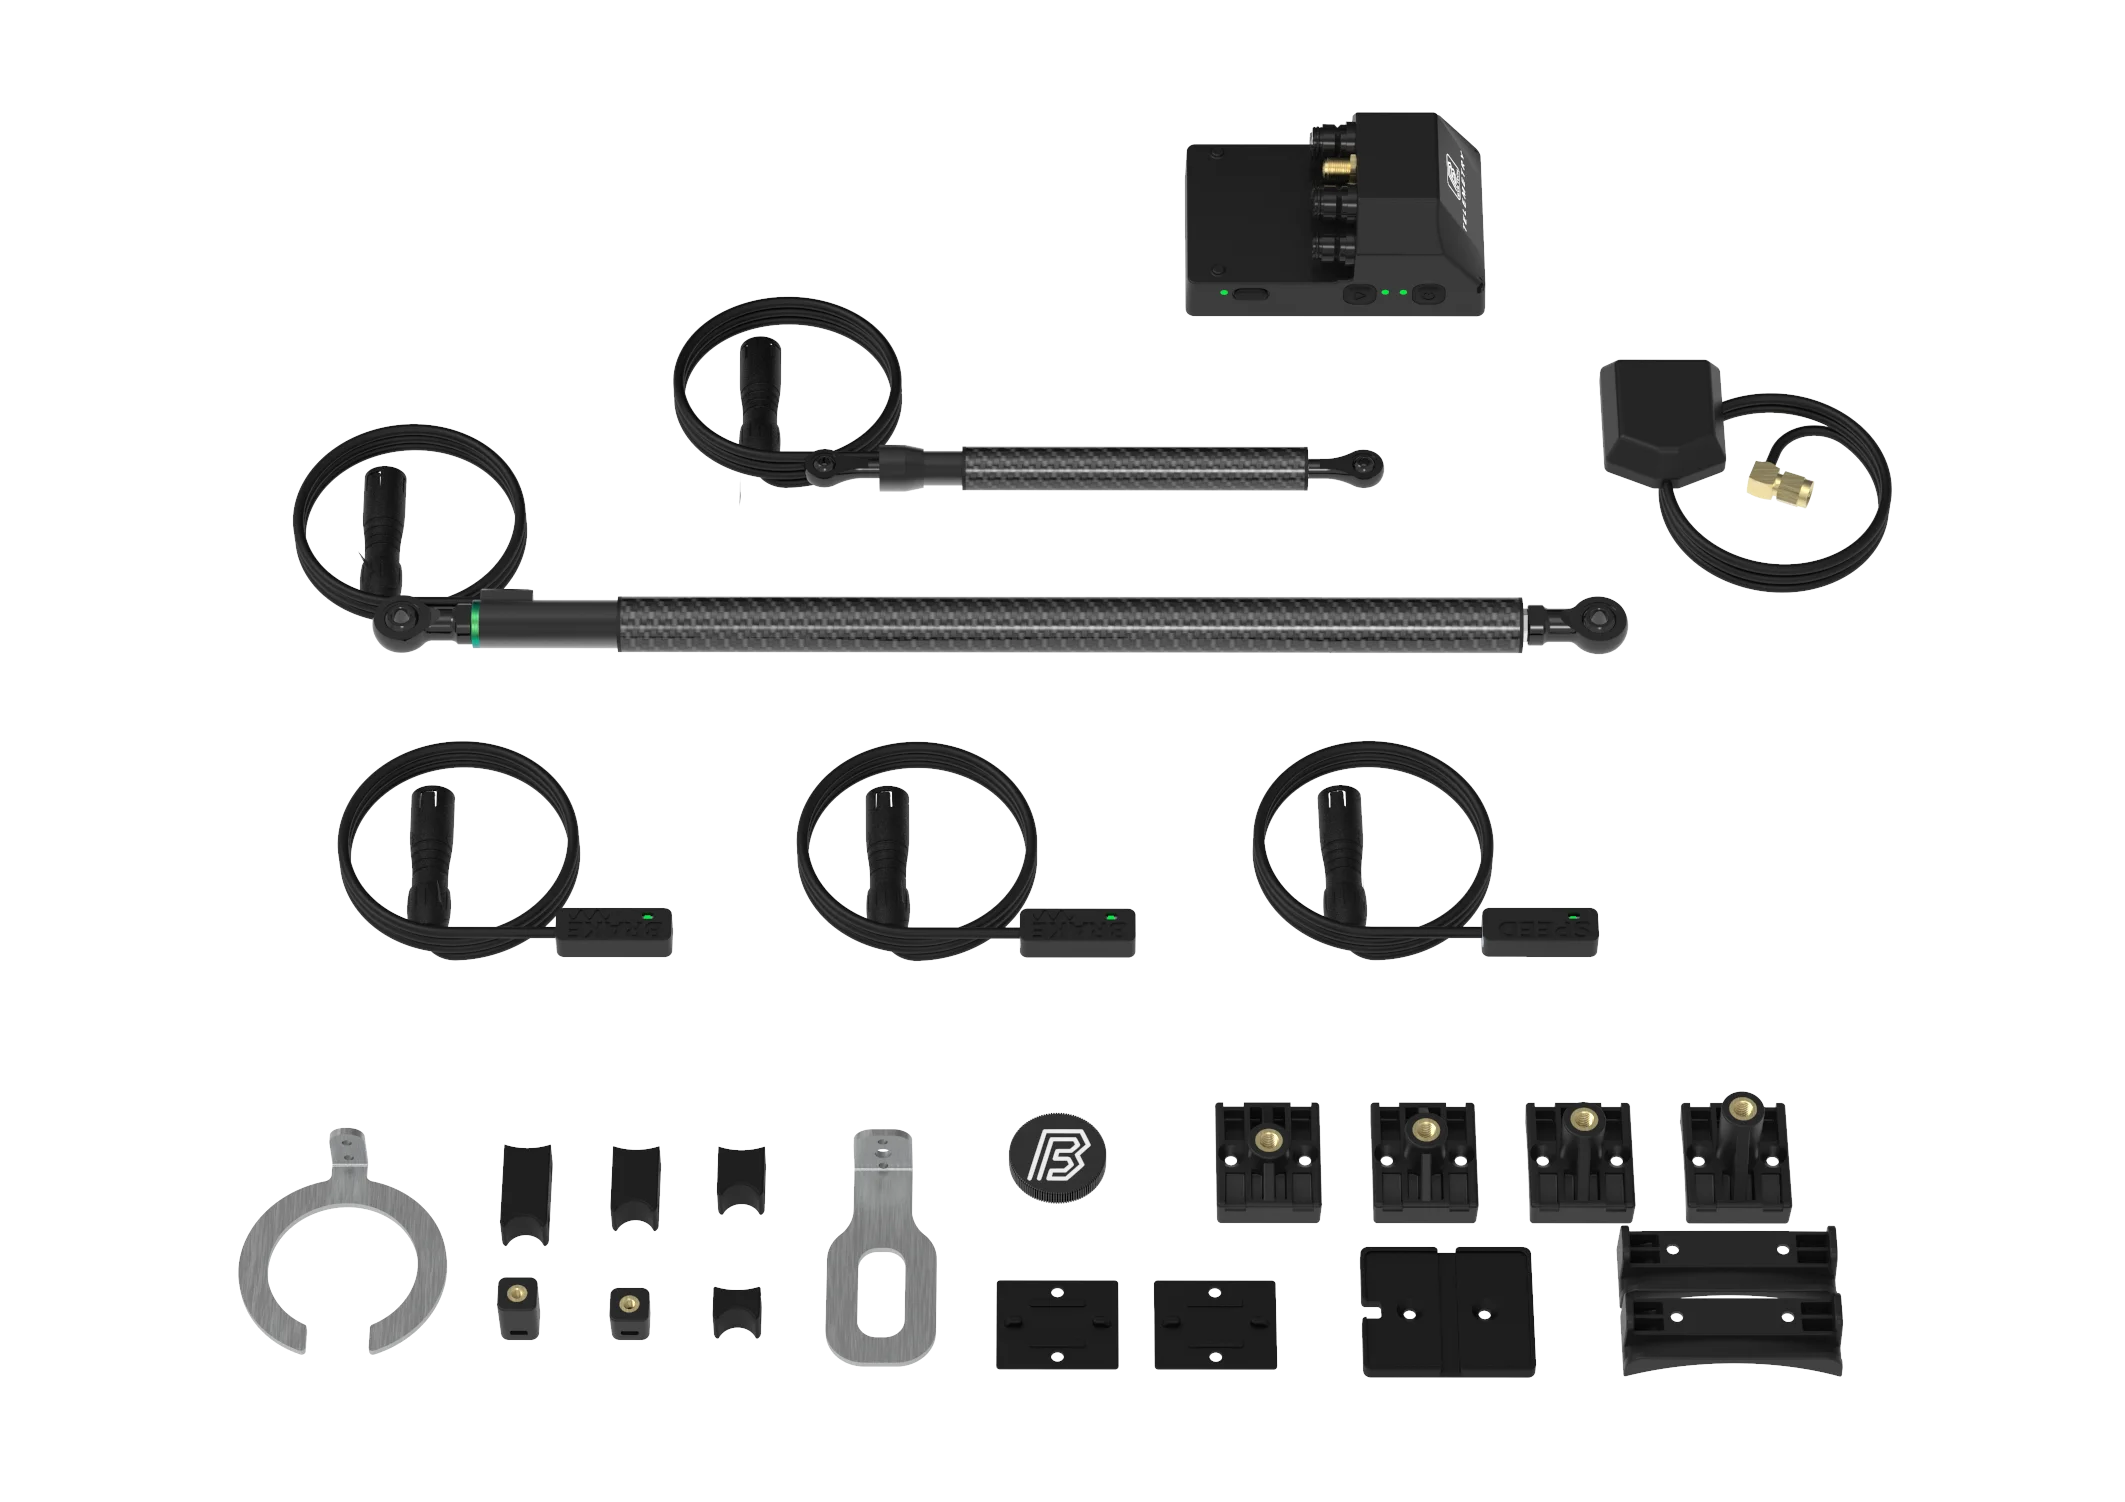
The system reads suspension position with linear sensors clamped to the fork and the rear shock. A small logging unit records each channel and time-stamps it against GPS and an onboard motion sensor. After the run, the BYB Telemetry software or smartphone app converts shaft movement into wheel travel using your frame's leverage ratio.
A typical BYB Telemetry V3 setup captures these mountain bike suspension telemetry channels:
• Fork travel through a 210 mm linear sensor
• Shock travel through an 80 mm linear sensor
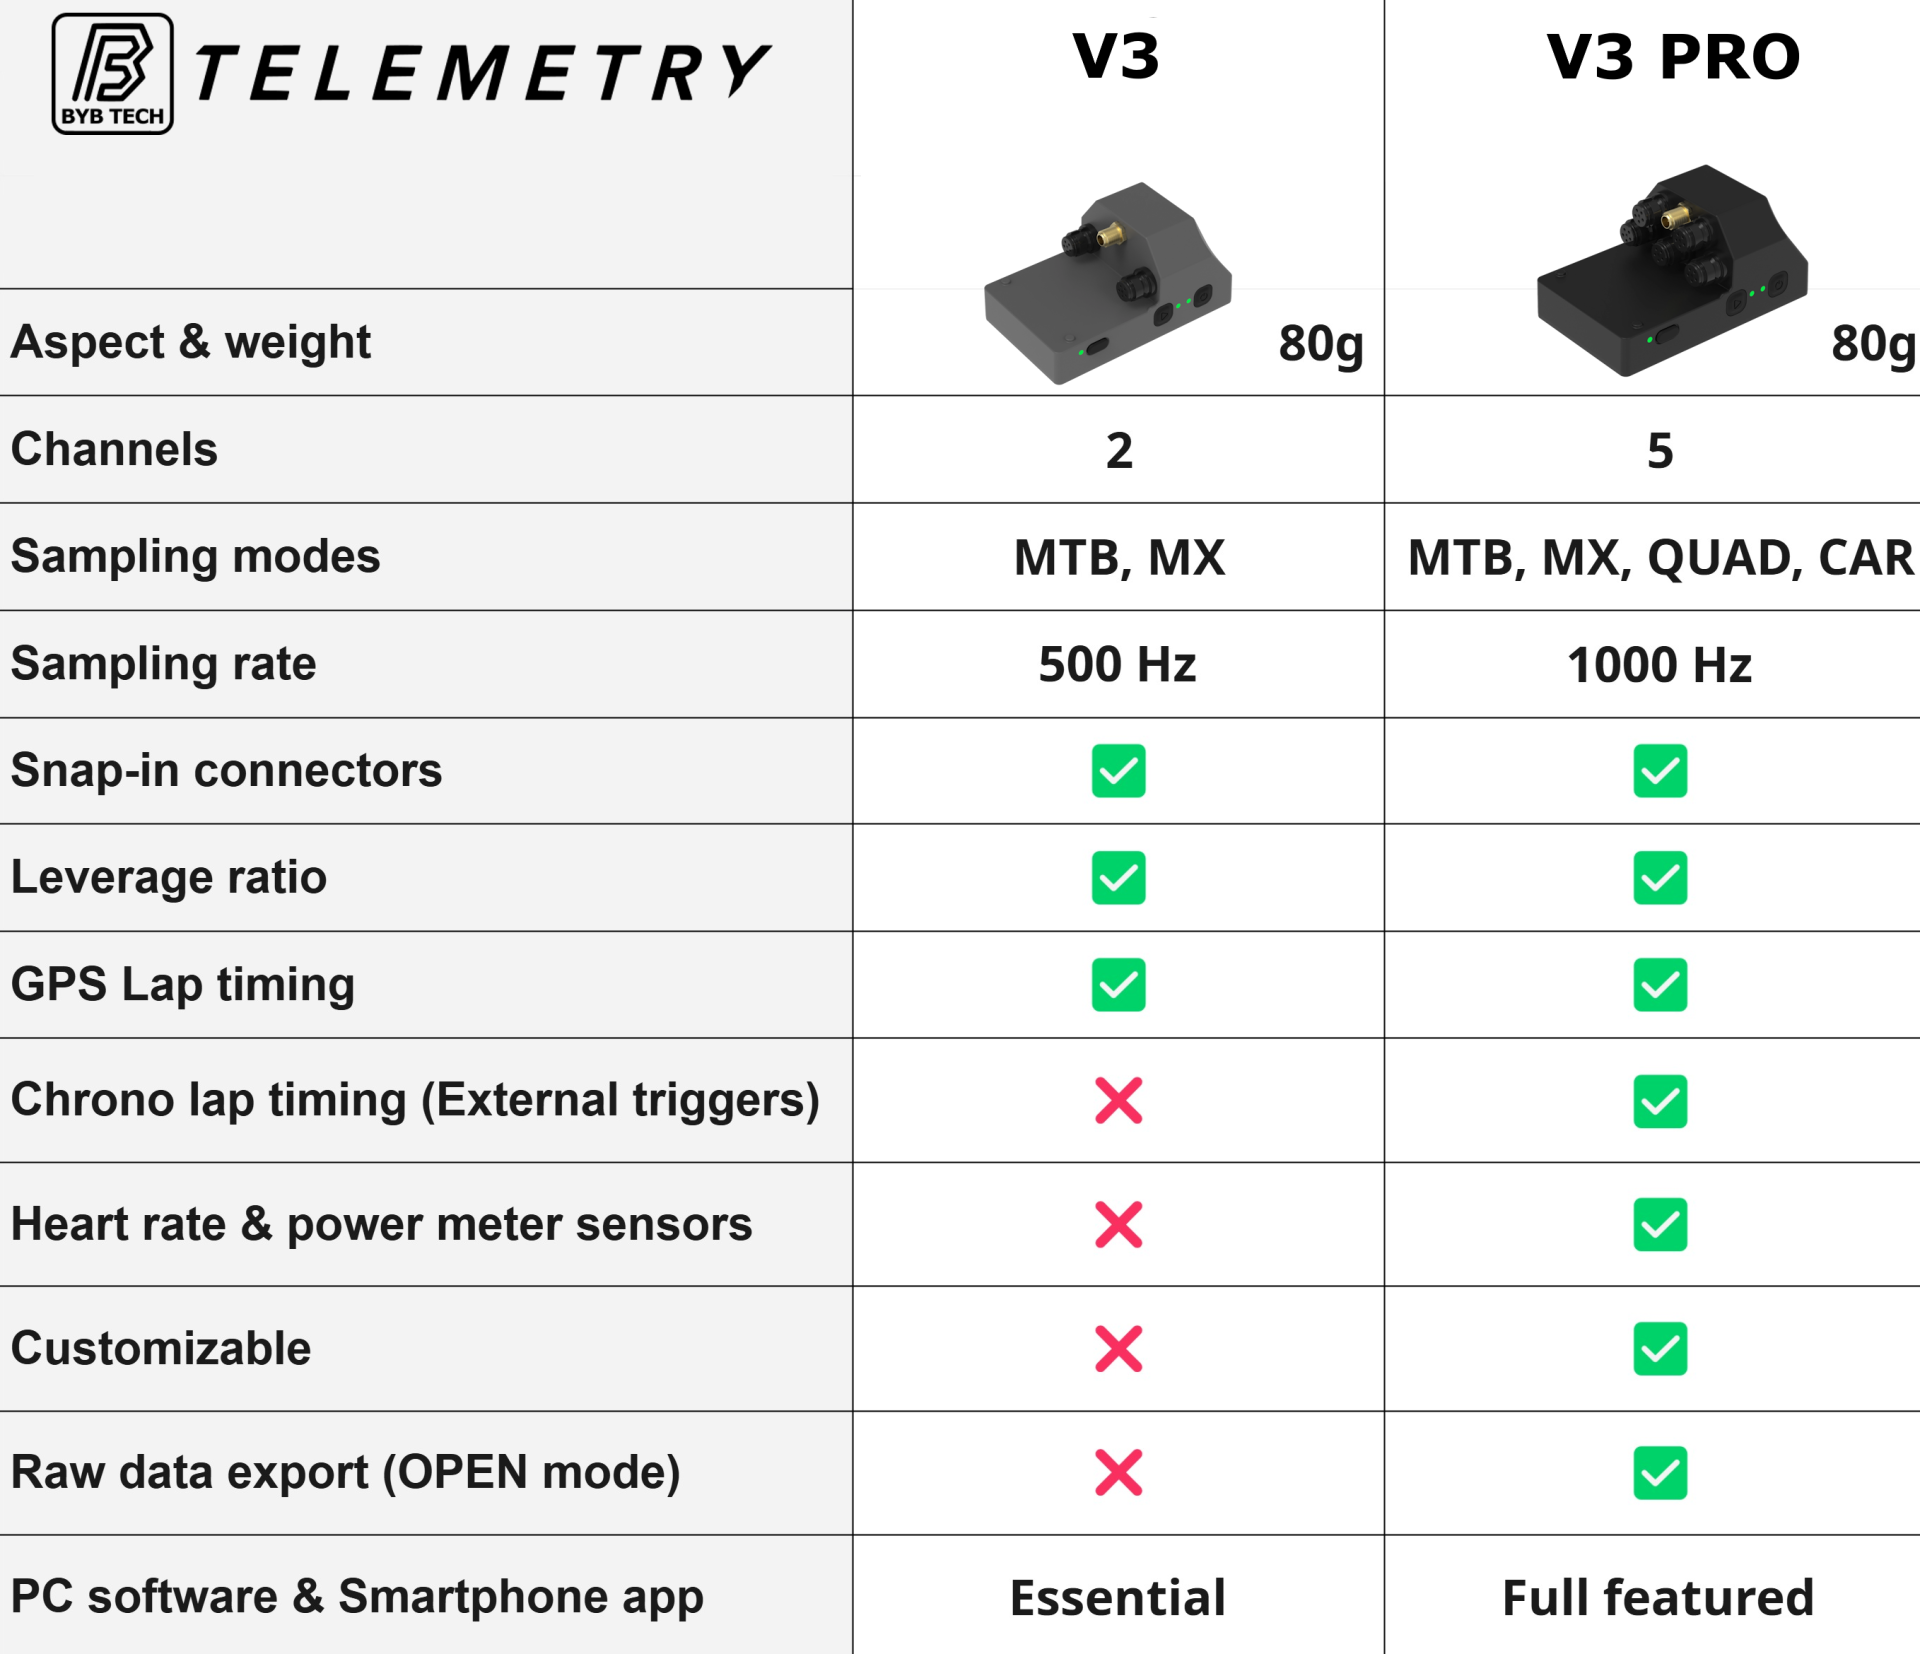
• Suspension position sampled at 500 Hz, or 1000 Hz on BYB Telemetry V3 Pro
• Motion from a built-in 6-axis accelerometer and gyroscope
• Position and ground speed from 25 Hz GPS
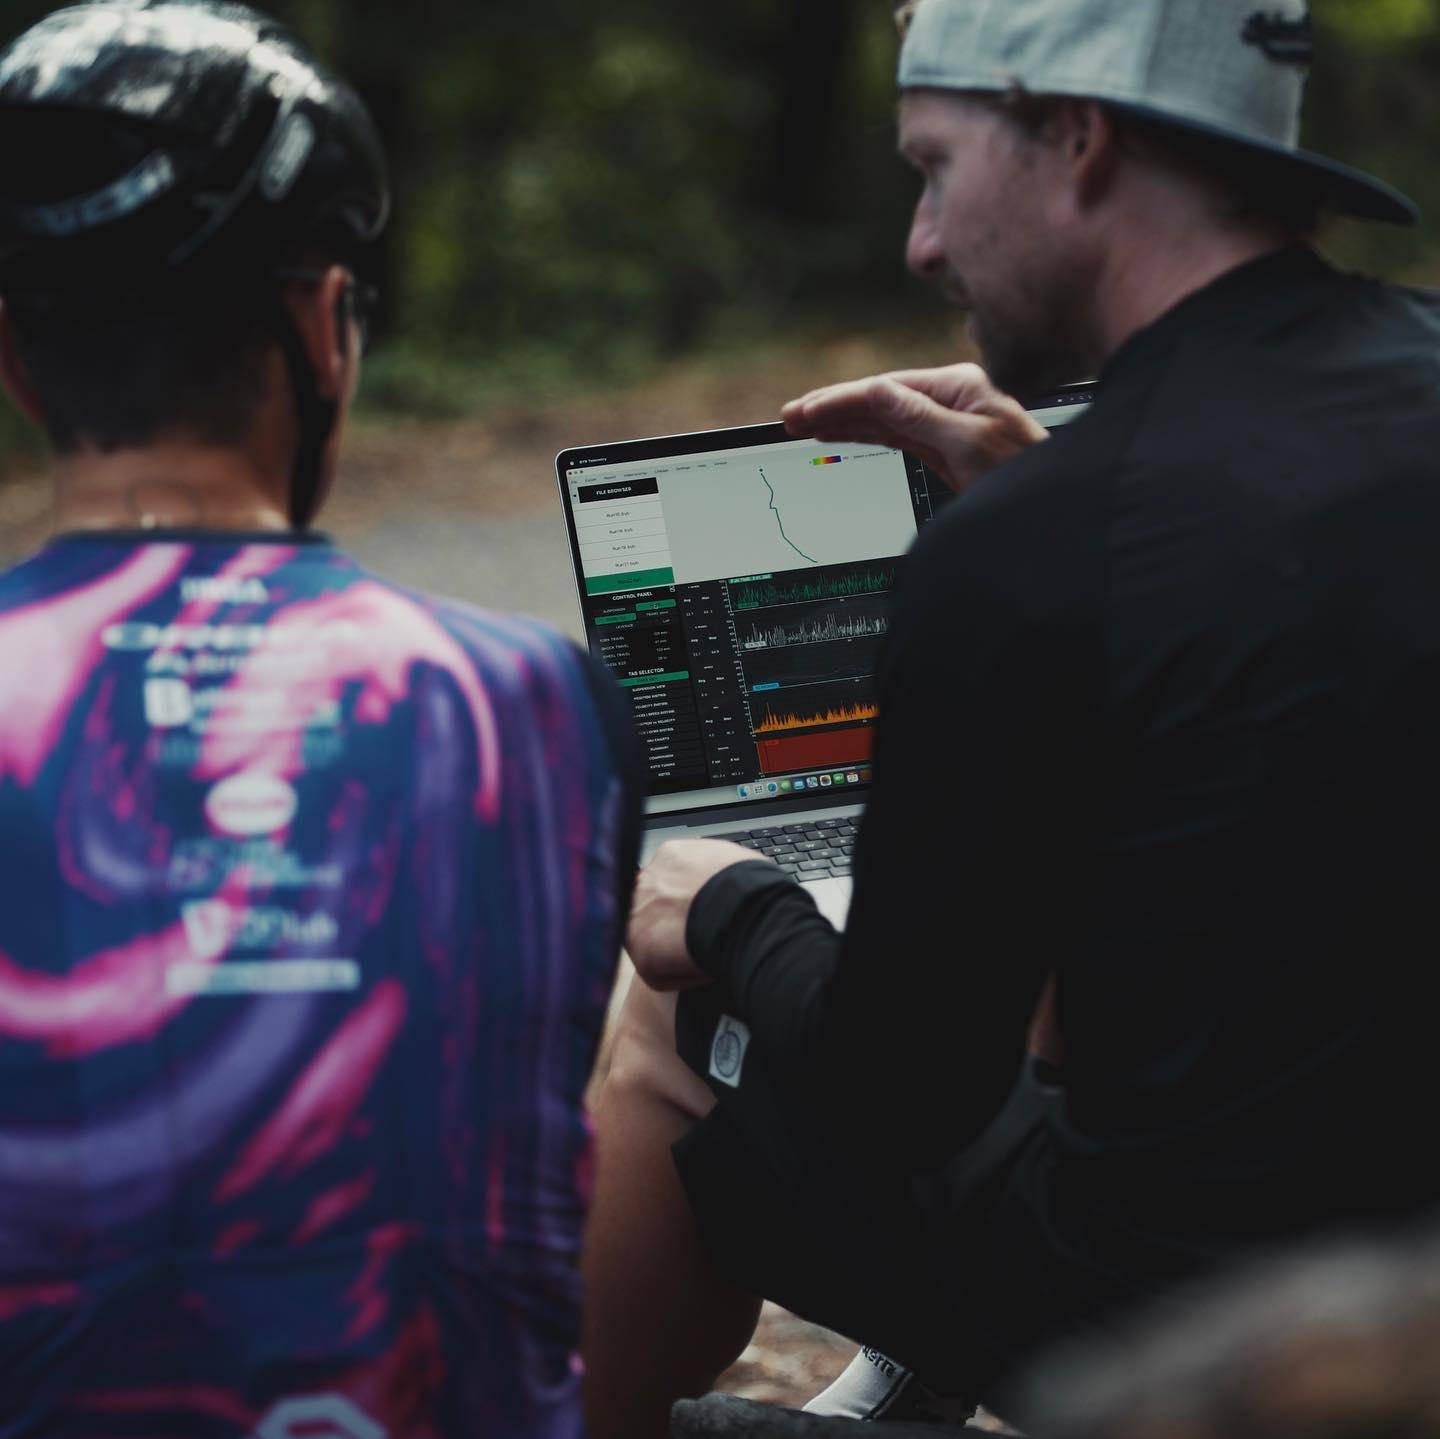
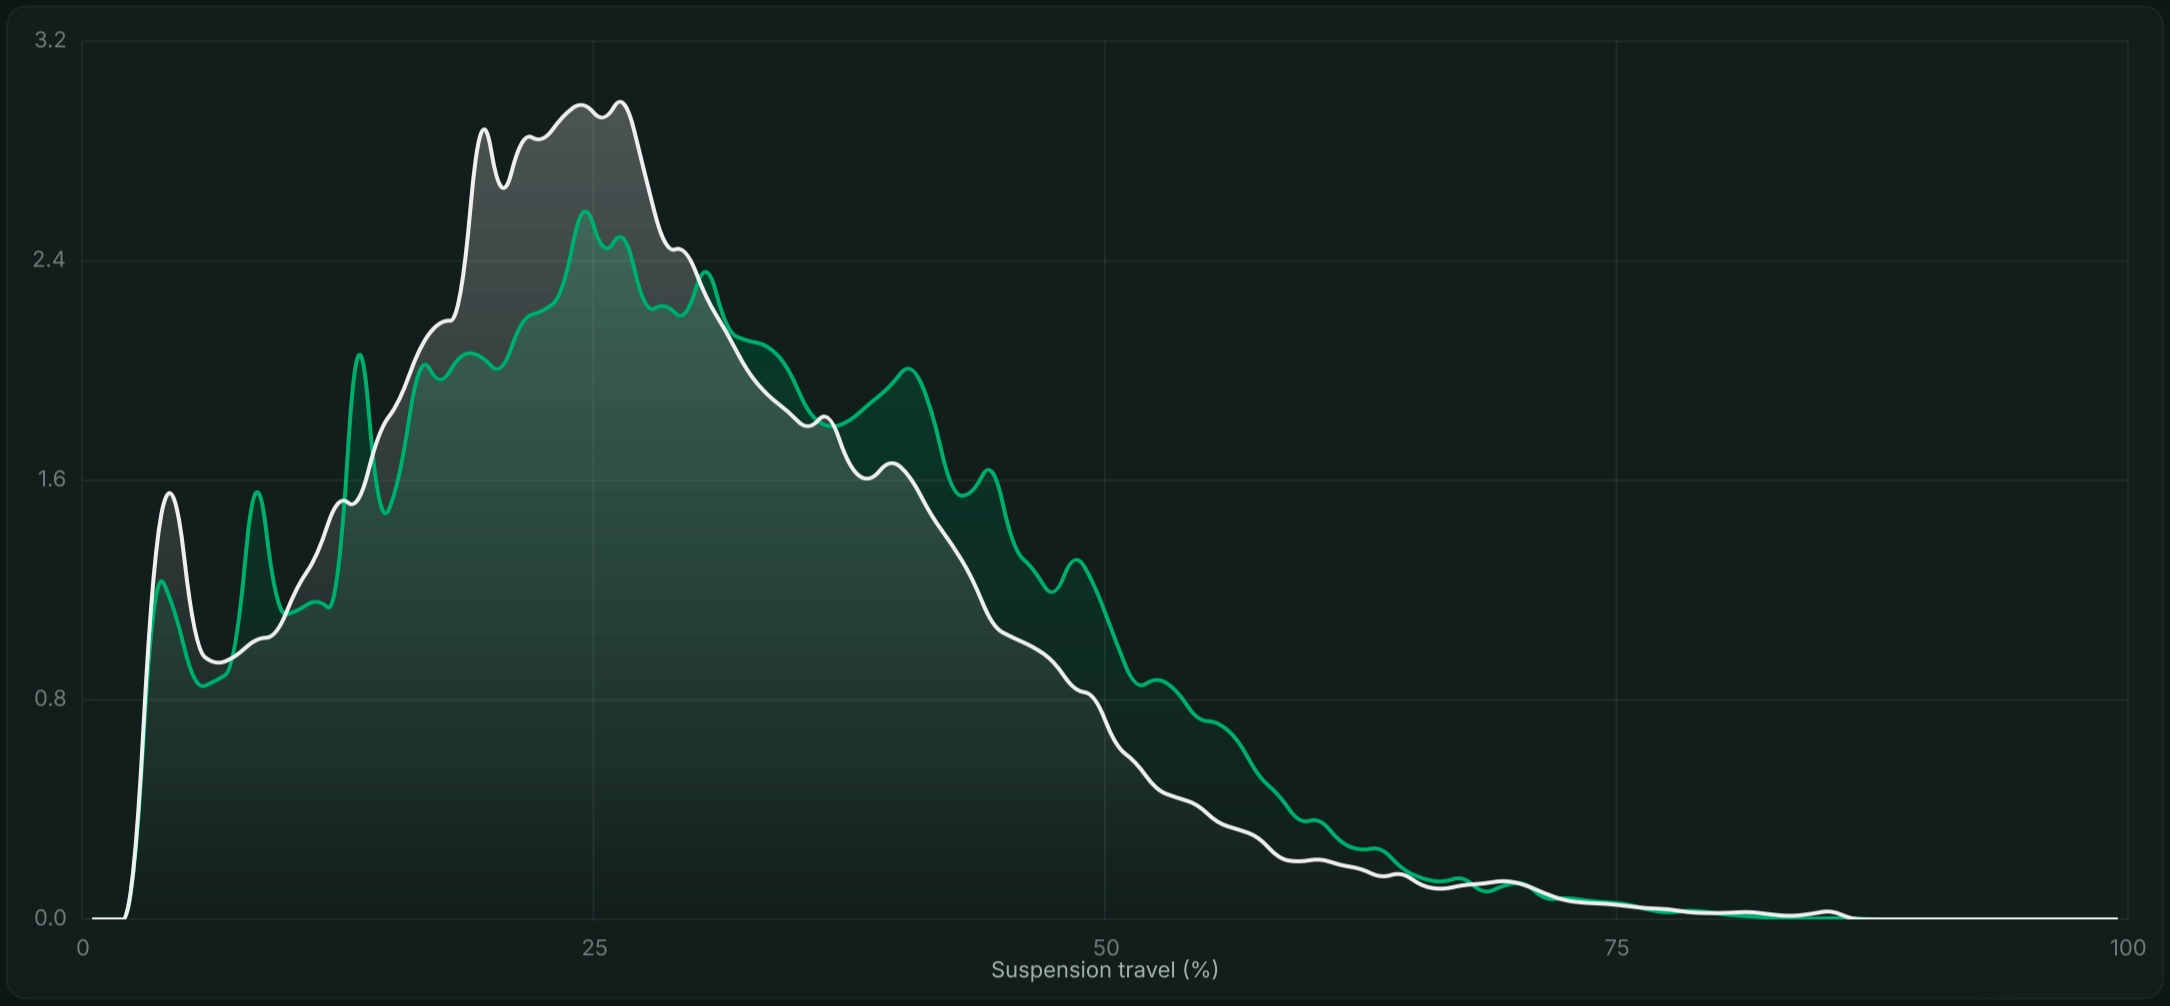
The headline output is the travel histogram — a chart of how much time the suspension spends at each point in its stroke. A peak near your dynamic sag means a balanced, supportive chassis, while a peak deep in the travel suggests you are running too soft or bottoming out.
Velocity data separates spring problems from damping problems. Rebound and compression speeds, plotted as a distribution, show whether the damper is controlling the spring or fighting it. Front-to-rear balance then reveals if one end dives or packs while the other sits idle.
Counting bottom-outs matters too. A handful of full-travel hits per run is normal and shows you are using the stroke; frequent harsh bottoming points to too little spring rate or too few volume spacers.
Example — a trail rider sees a rear travel histogram peaking at 20% travel, a sign of an over-firm setup. Dropping shock pressure from 200 PSI to 185 PSI shifts the peak toward 30% sag, confirming fuller, more controlled use of the stroke. The values are illustrative.
A useful session is a controlled experiment: ride the same trail, change one variable at a time and compare the data. This is the core of any honest suspension tuning workflow.
• Set baseline sag and note your current pressures and clicker settings.
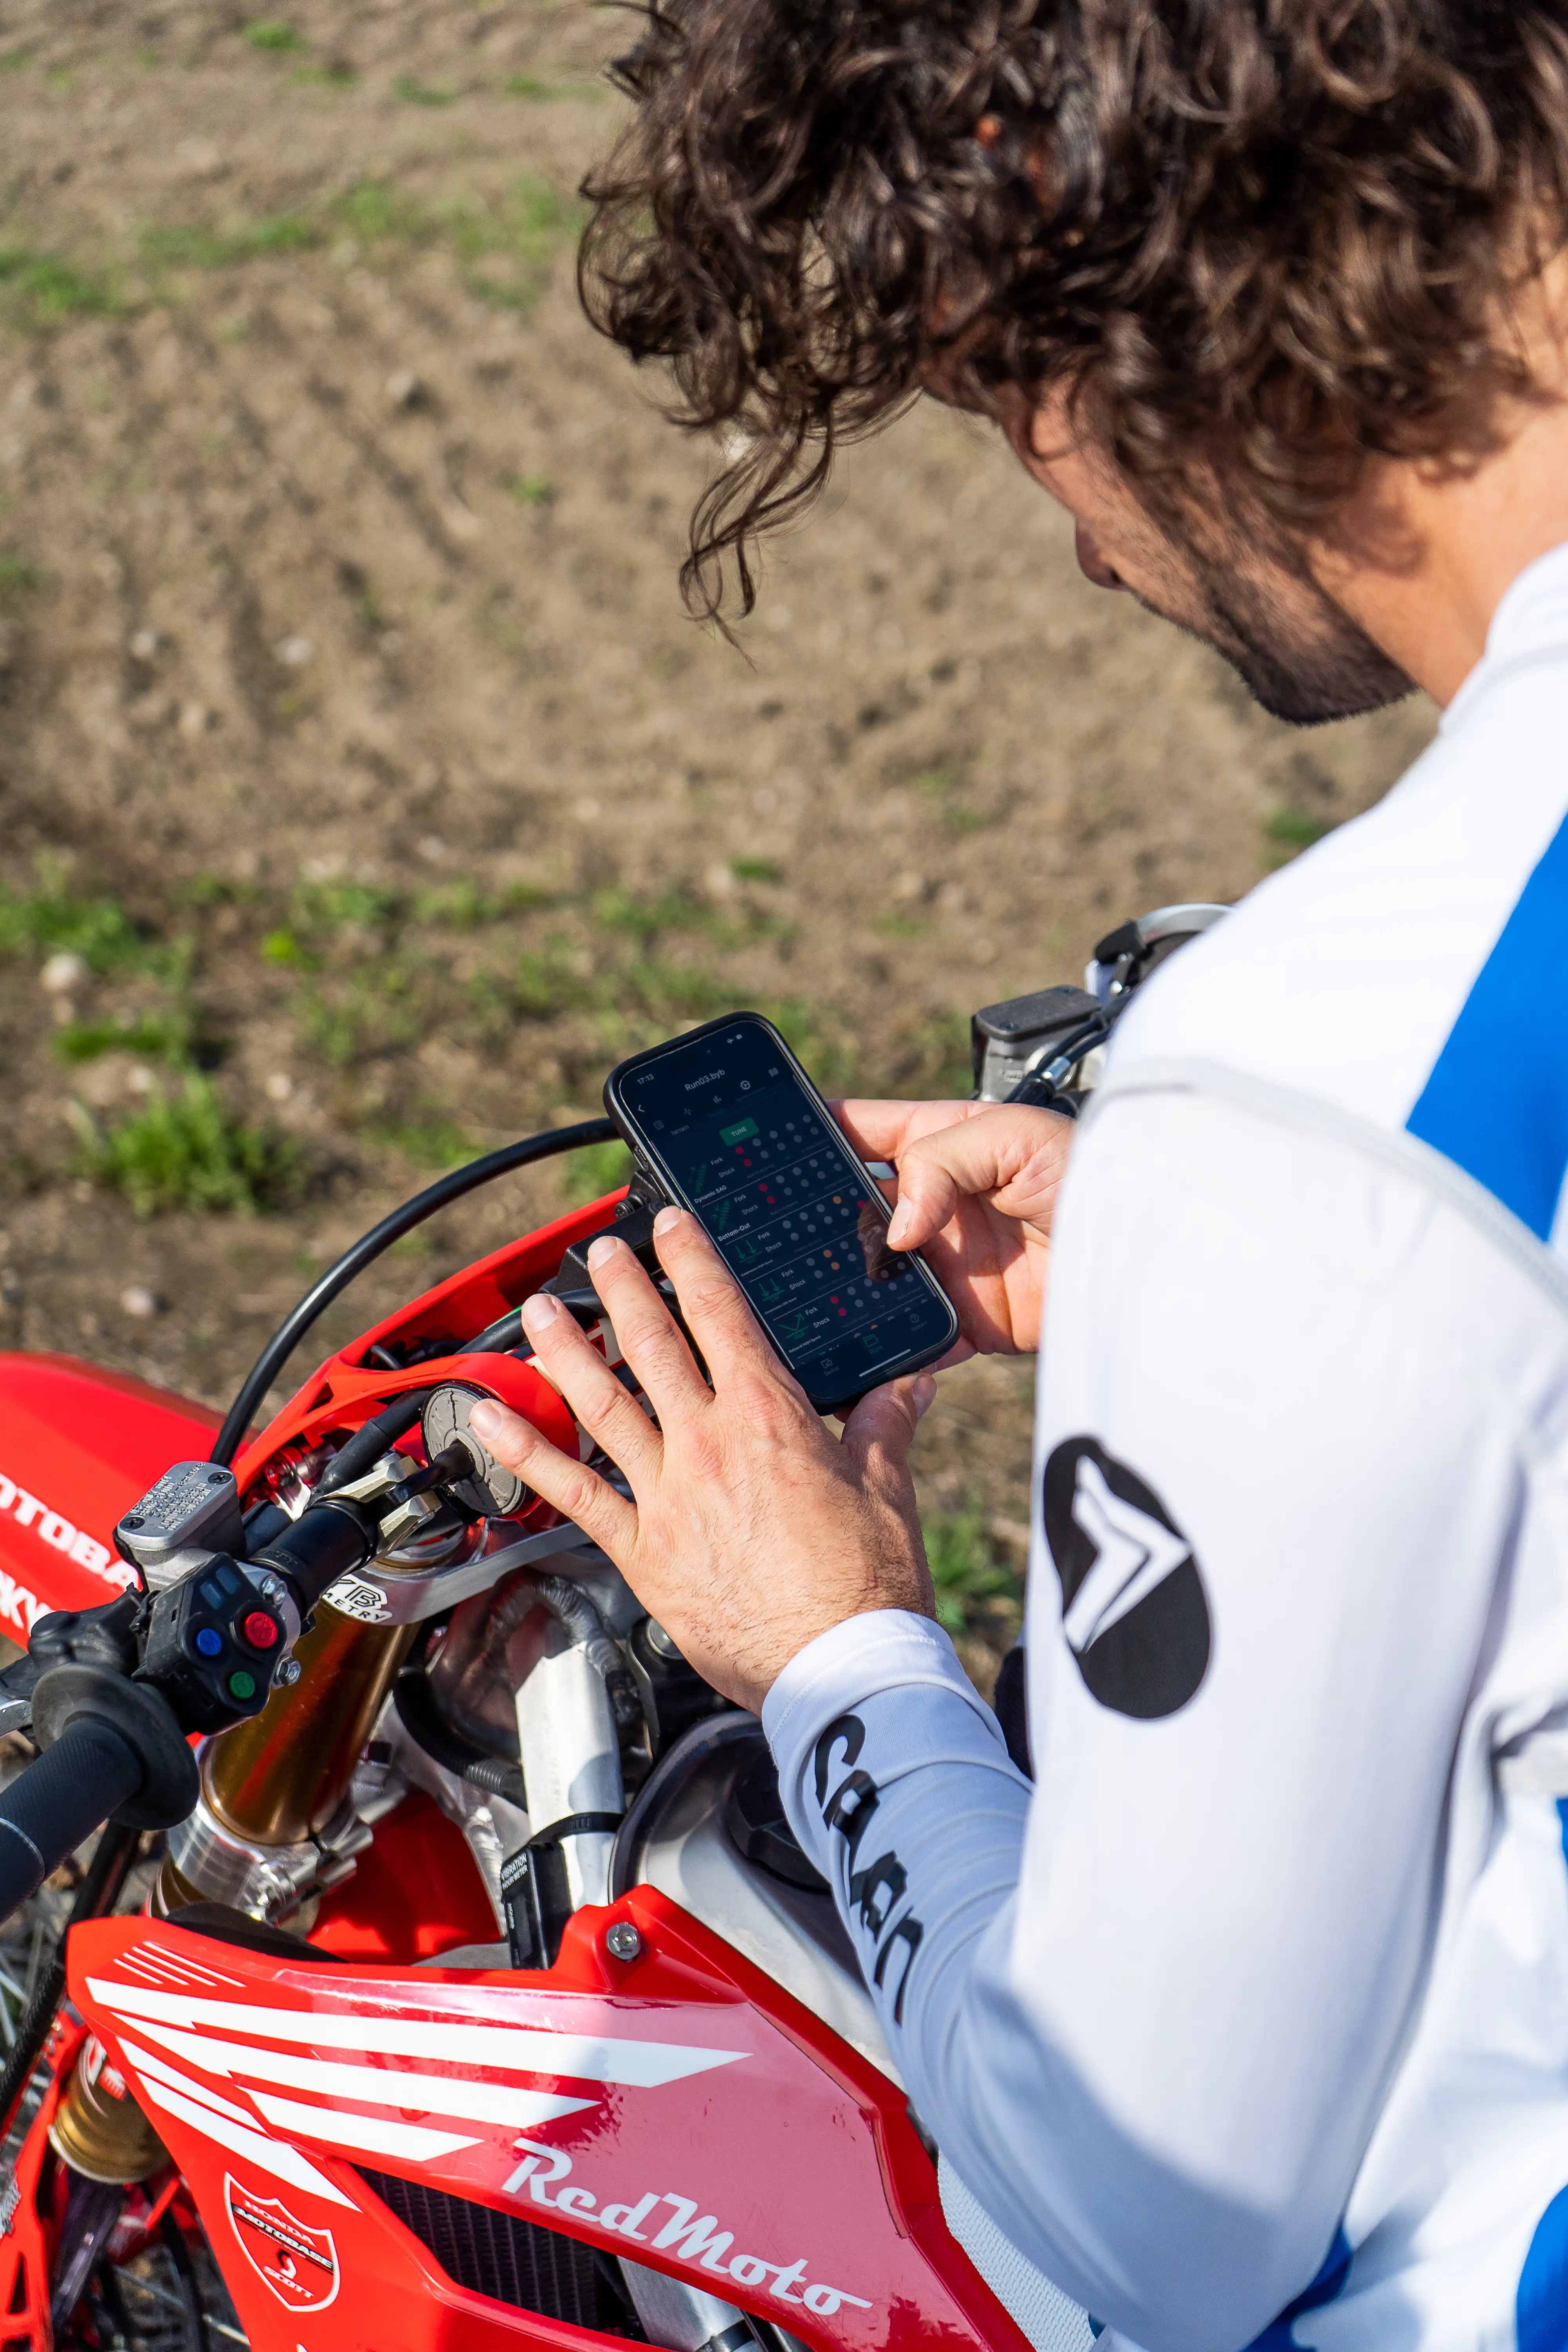
• Mount the sensors and pair the unit with the app.
• Ride a consistent reference segment at a repeatable pace.
• Review the travel and velocity histograms after the run.
• Change one setting — pressure, rebound or compression.
• Repeat the same segment and compare the new data against the old.
Both units share the same sensors, motion unit and GPS; the difference is resolution and channel count. BYB Telemetry V3 suits privateers that want pro-level data affordably. BYB Telemetry V3 Pro targets race teams, bike shops and tuners who need more channels, deeper insights, and raw export.
To run these measurements on your own bike, explore the BYB Telemetry Kit and review the full sensor package.
These data acquisition principles carry across disciplines, from downhill to enduro, because the method — measure, change one thing, re-measure — never changes.
• Do you need data acquisition to set up your suspension?
No, but it removes the guesswork. Sag charts get you close; telemetry confirms what the fork and shock actually do at 500 Hz and shows whether a change helped.
• What is the difference between BYB Telemetry V3 and V3 Pro?
BYB Telemetry V3 logs fork and shock at 500 Hz over two channels. BYB Telemetry V3 Pro doubles that to 1000 Hz, adds speed and brake channels, deeper insights, and exports raw data.
• Can you use telemetry on any bike?
Yes. The linear sensors fit standard forks and shocks, and the software maps shaft travel to wheel travel using your frame's leverage ratio.